

Find your factory’s hidden capacity, become more resource efficient
RS Production® OEE gives you the insights needed to make better and fact based decision. It help you cut production costs, get real-time control, and use fewer resources per produced unit. Improving Overall Equipment Efficiency (OEE) is both profitable and sustainable.
No more need for spreadsheets, pencils and paper for production follow up. Get a ready-to-start configuration up in 5 minutes with the guided wizard.
Make better, fact-based decisions
Automatically identify machine time losses in real-time. Operators can add their unique domain expertise with loss codes, comments, and more using a touch screen at the machine.
Easily understand data from machines and operators with standard reports designed to help your teams make fact-based decisions.
Get insight into production losses, react quickly and accurately to deviations, and get visual facts for your meetings and improvement work.
Features
Look here for Products, variants and functionality
OEE
Complete OEE capabilities including
-
automatic (or manual) downtime, speed loss and scrap logging
-
manual and/or automatic reason coding
-
Downtime
-
Speedloss
-
Scrap
-
Rework
-
-
automatic changeover logging
Machine monitoring
OPC UA, 24V signals and Webservice API are the most common machine interfaces to capture machine data and events.
-
uptime/downtime
-
production cycles and produced amounts (incl scrap and rework)
-
current article/product and order
-
automatic stop and other loss information
Read more about
Block and release
Evaluate a product with quality defects. Should it be discarded, reworked, or can it continue in the flow as is?
-
blocking and releasing
-
printing pallet flags
-
First time pass (PPM) analysis reports
Plug and play with RS IoT box
Use our self designed RS IoT box to easily capture machine signals to the cloud service
-
Data capture over 4G network or factory WiFi
-
8 inputs per box
Learn more about RS IoT - Technical Data
Production follow up
Follow production net-output per production run (order or article) by
-
produced amount
-
produced, scrapped, reworked, approved amount
-
product/order run
-
production order plan
Visual operator screens
Provide operators with relevant information such as
-
production plans
-
loss coding
-
visual shift targets report
Read more about RS Production Operator tools user interface
Reports and KPI's
50+ standard reports including
-
pareto charts
-
OEE waterfall
-
cycle time analysis
-
change over matrix
-
various filter and sorting
-
automatic report e-mails and prints
Live TV-screen dashboards
Visualize live production status factory wide using
-
a range of standard TV-screens
-
no-coding customization
-
25+ visual components
Learn more about RS Production Screens
Mobile access
Live production data at your fingertips with mobile
-
OEE
-
production output
-
production times
-
messaging (chat) system
-
iPhone, Android, Windows support
See more about RS Production Mobile
Loss analysis
No extra software is required to optimize production by analyzing
-
OEE and losses
-
combine dimensions
-
loss drill down reports
Messaging system
Enable team communication inside your factory with
-
direct messages
-
message groups for relevant communications within or cross organizations
Integrations
-
production plans and orders
-
articles/products
-
production data (
Go here to read a
Cloud operated
RS Production is generally cloud operated.
Learn more about Cloud service and data security
Operator tools
Here’s a selection of features in Operator tools
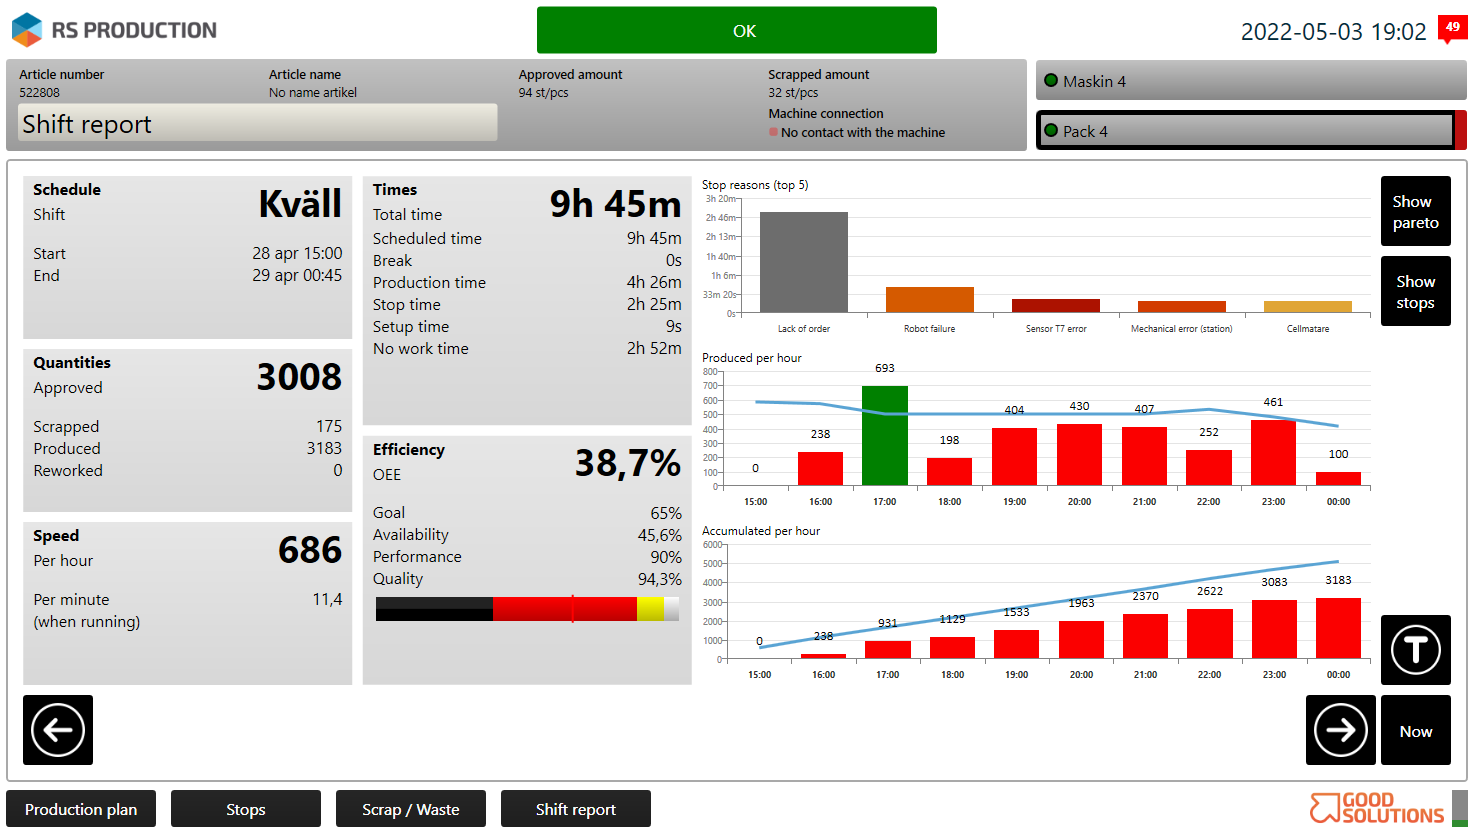
Real time overview of status against plan and top losses.
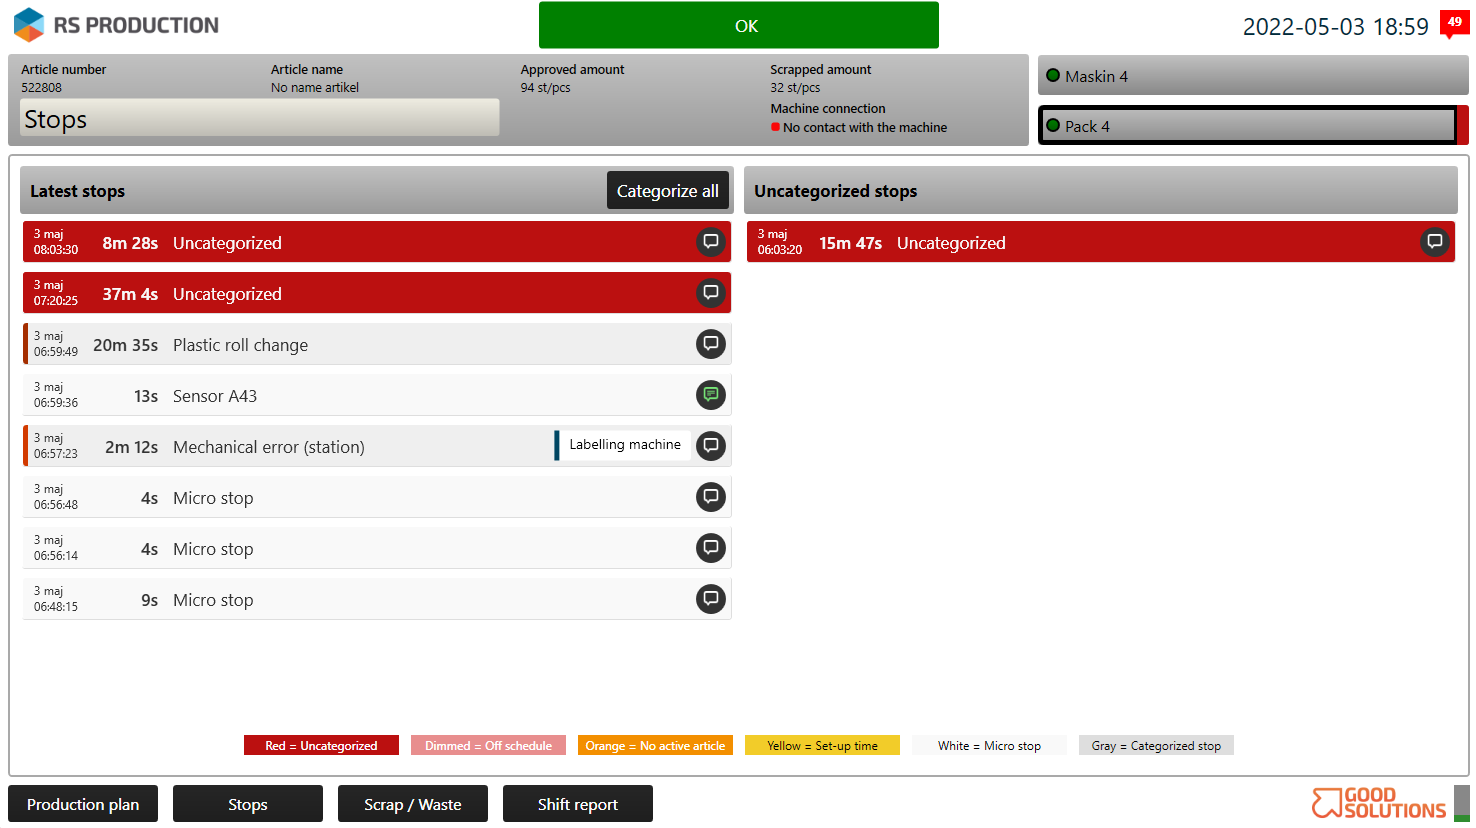
Real time view of OEE losses and visual user interface for operator to add reason codes and comments.
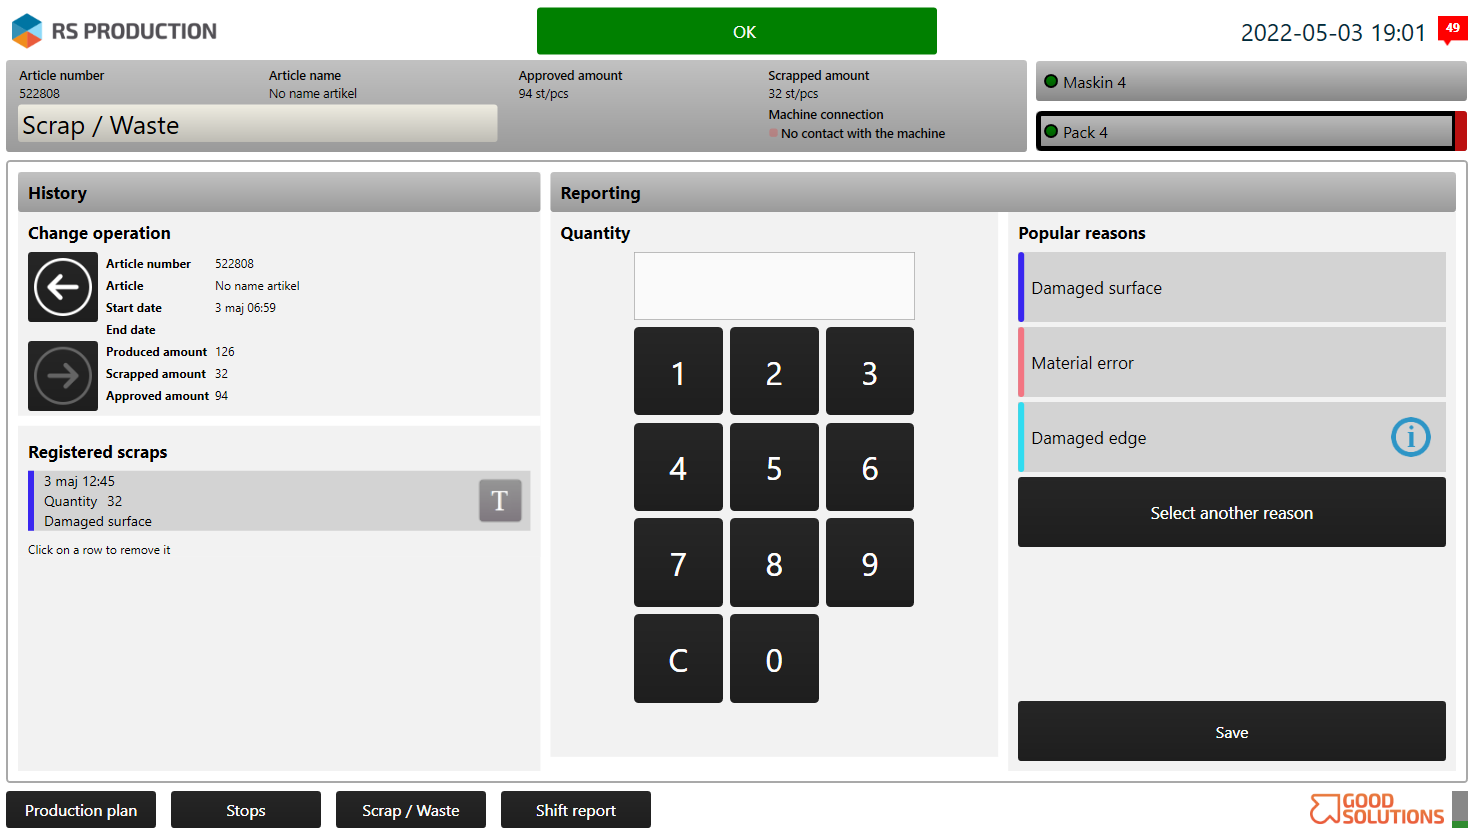
Scrap and rework registration
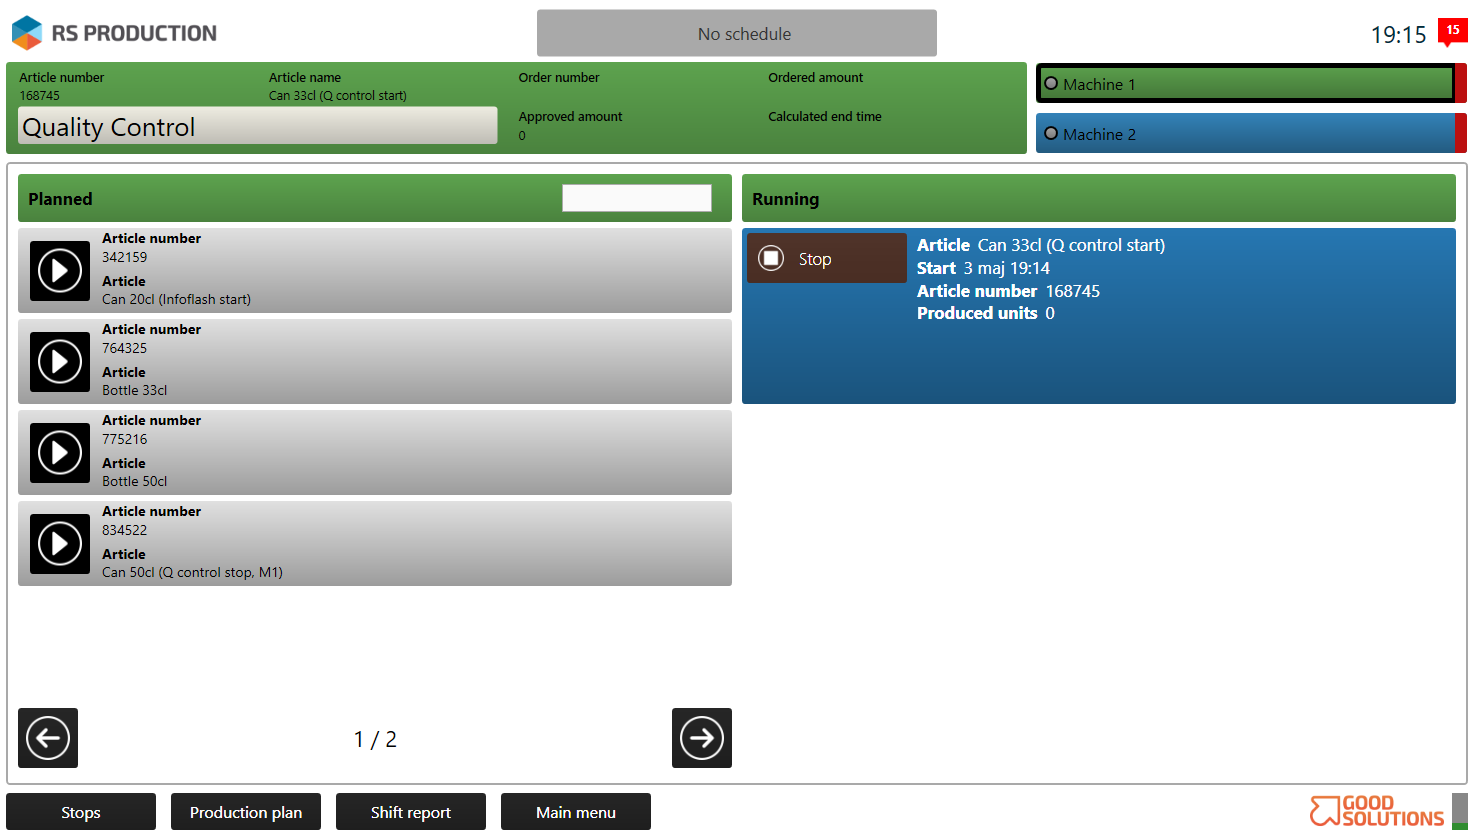
Visual production plan to change running order and/or item (article)
Reports and analysis
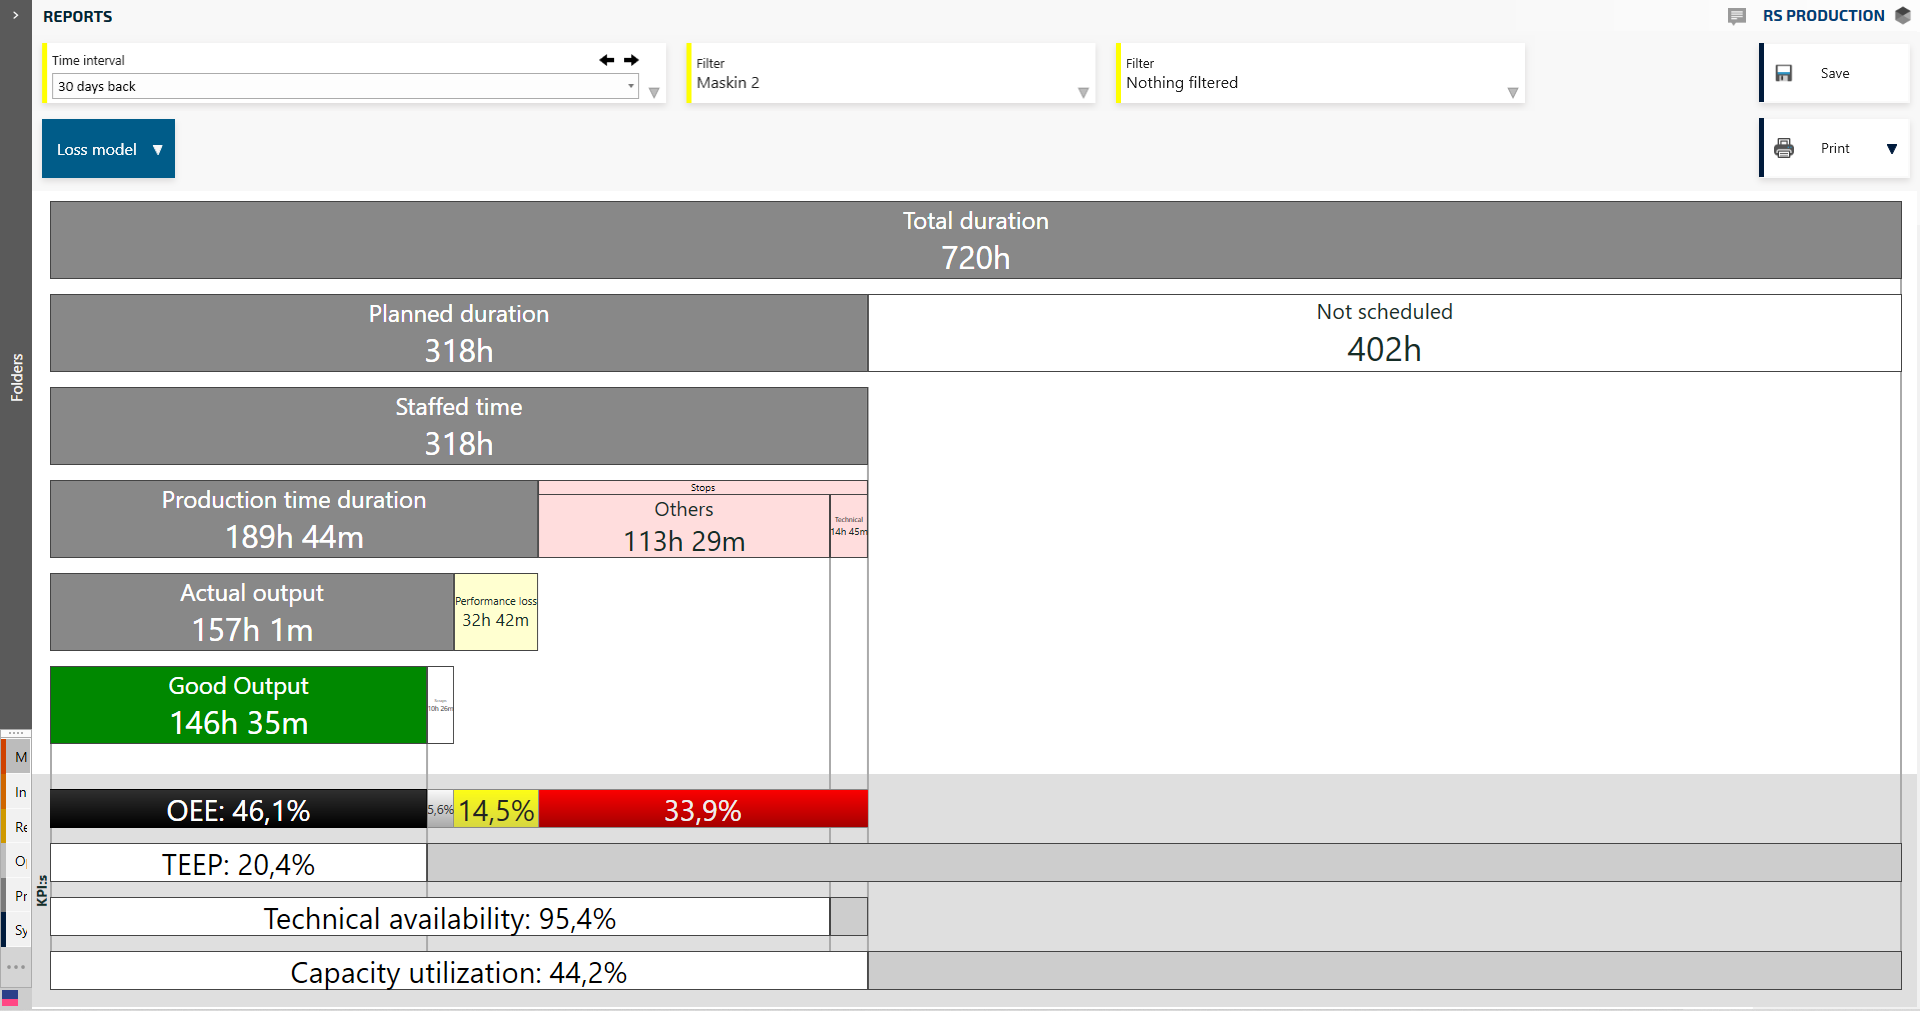
The visual OEE loss model reveals the hidden capacity in machines and factories.
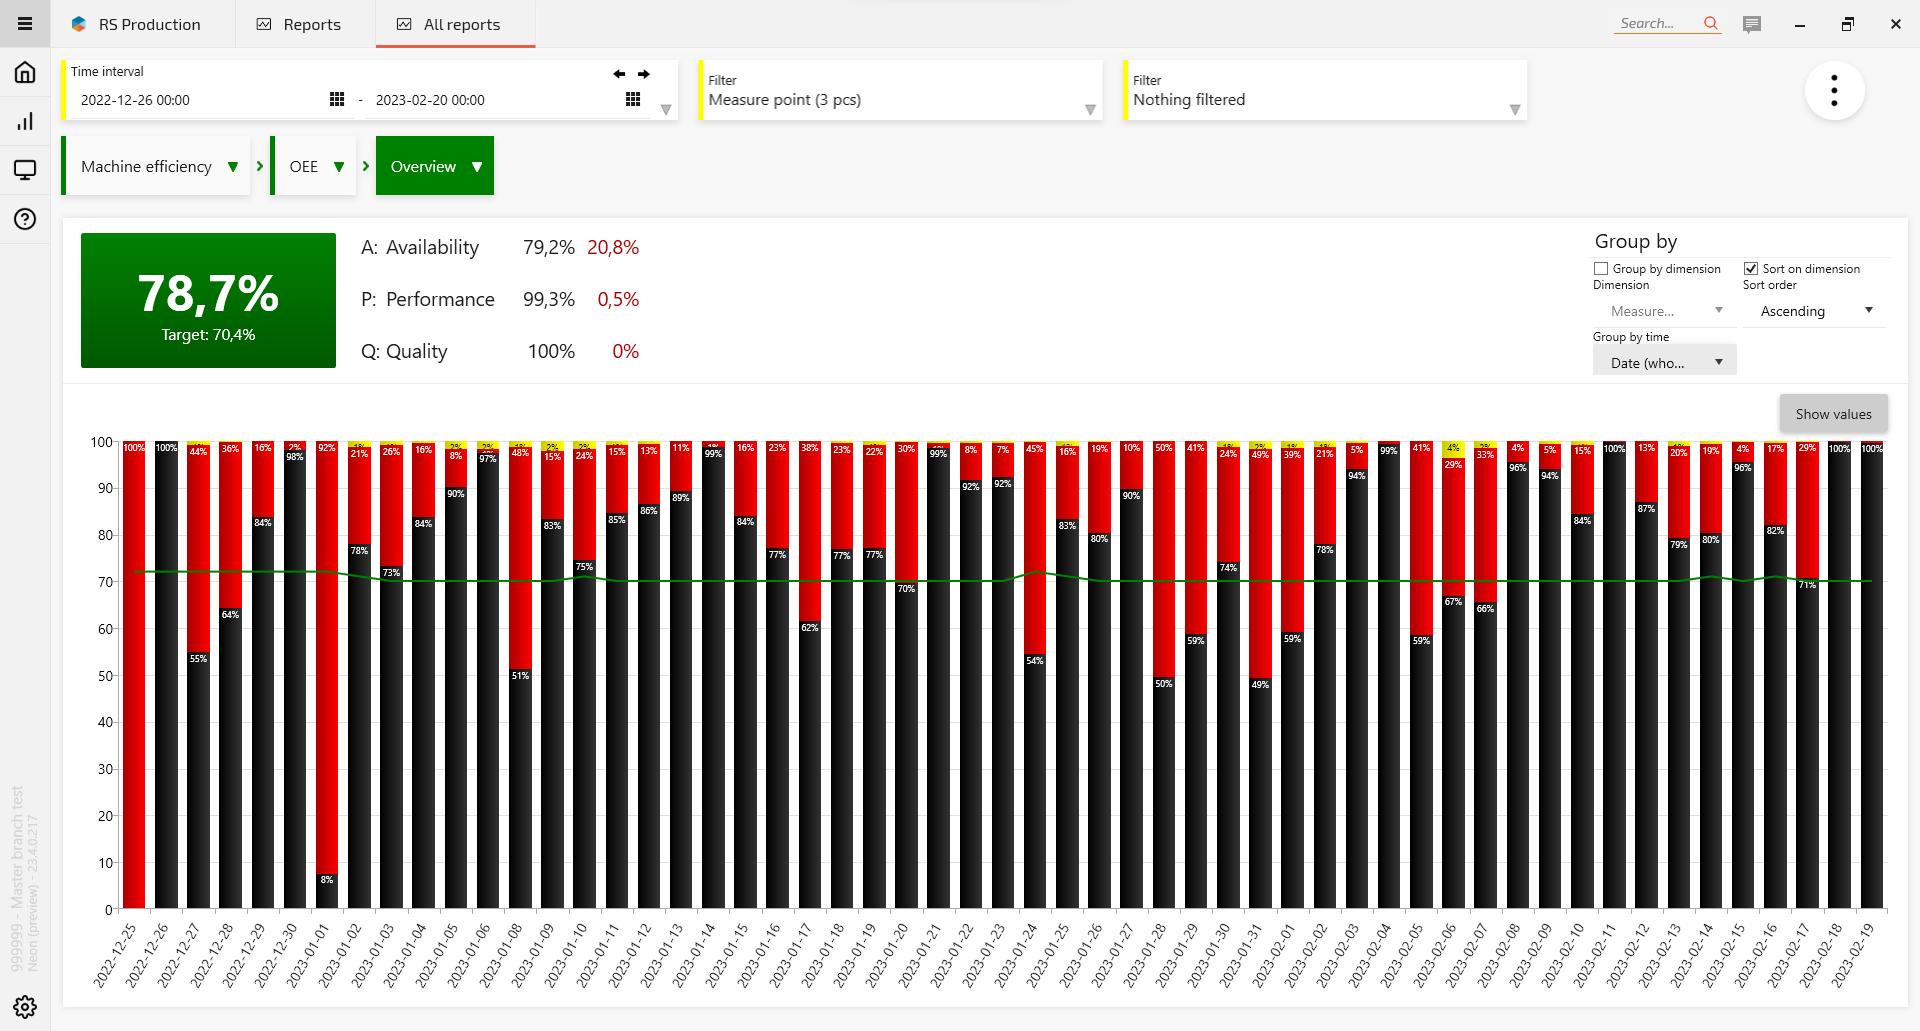
The OEE overview report helps understanding more about the OEE losses. Click to drill down and the underlaying reasons.
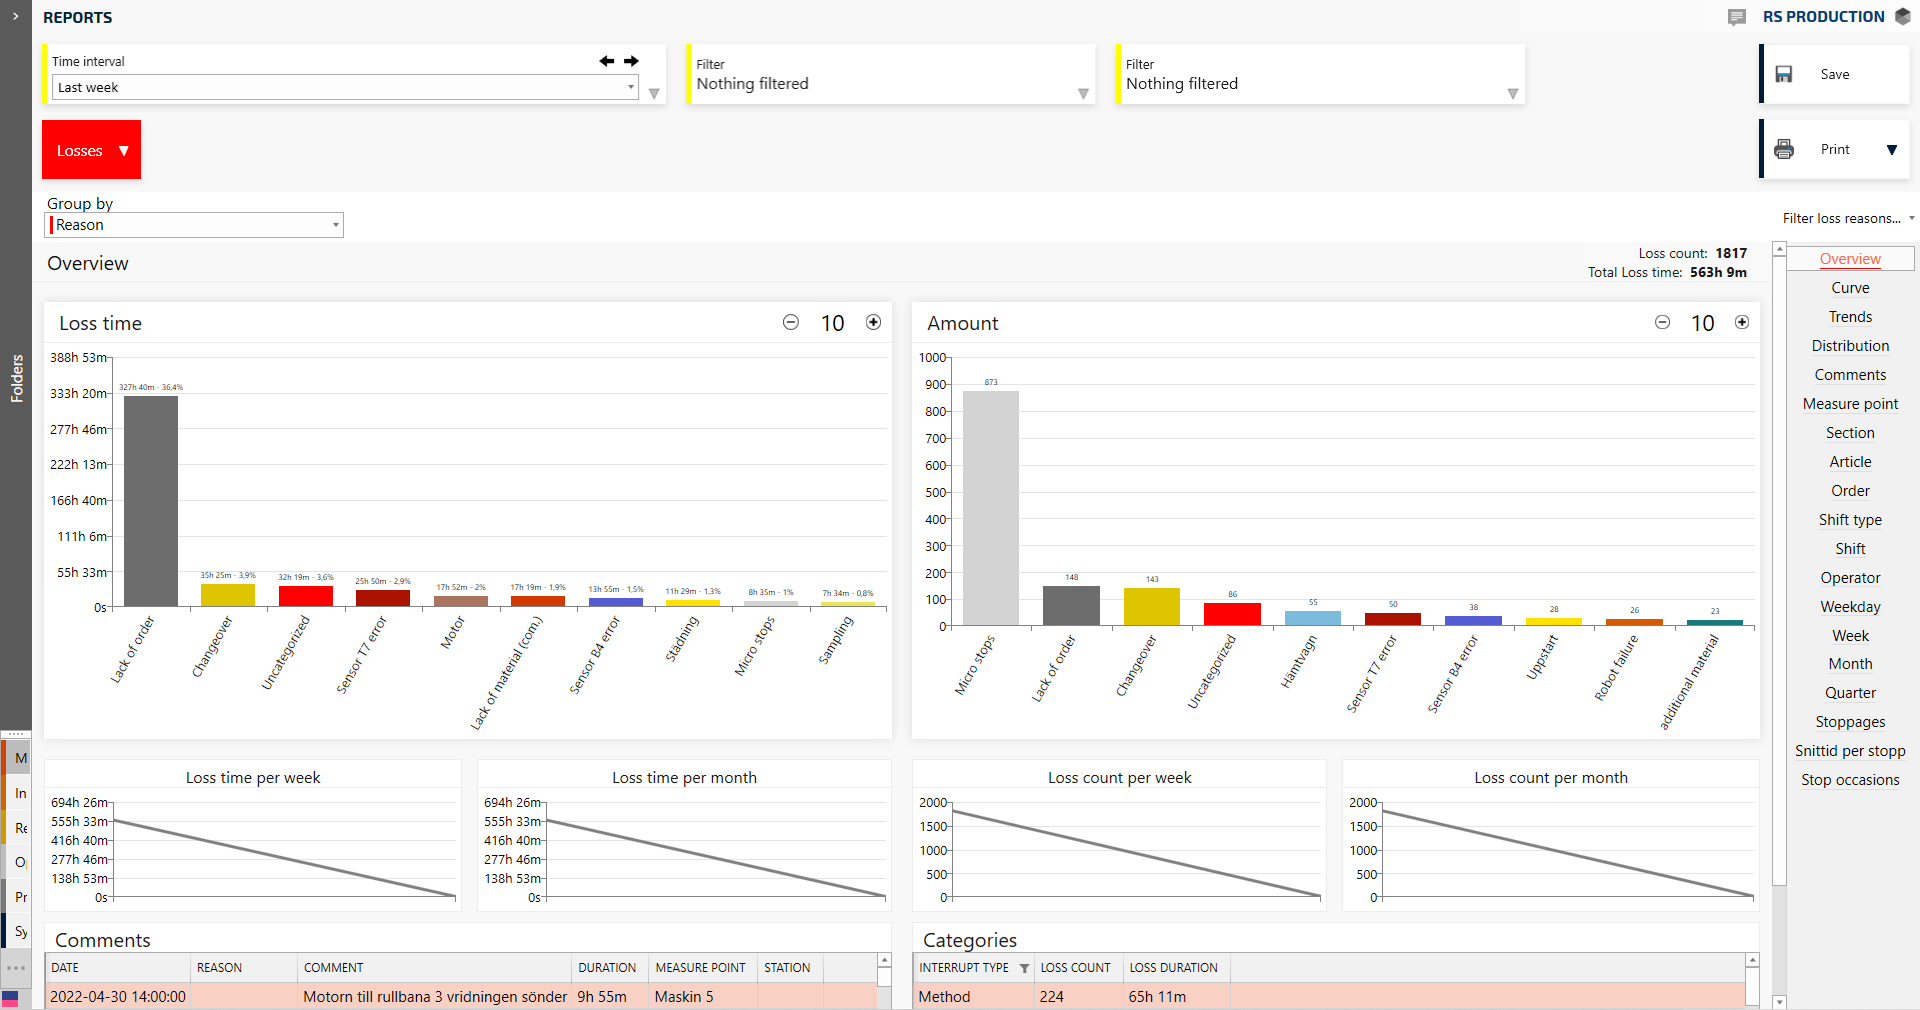
Visual pareto diagrams show the reasons behind the OEE losses.
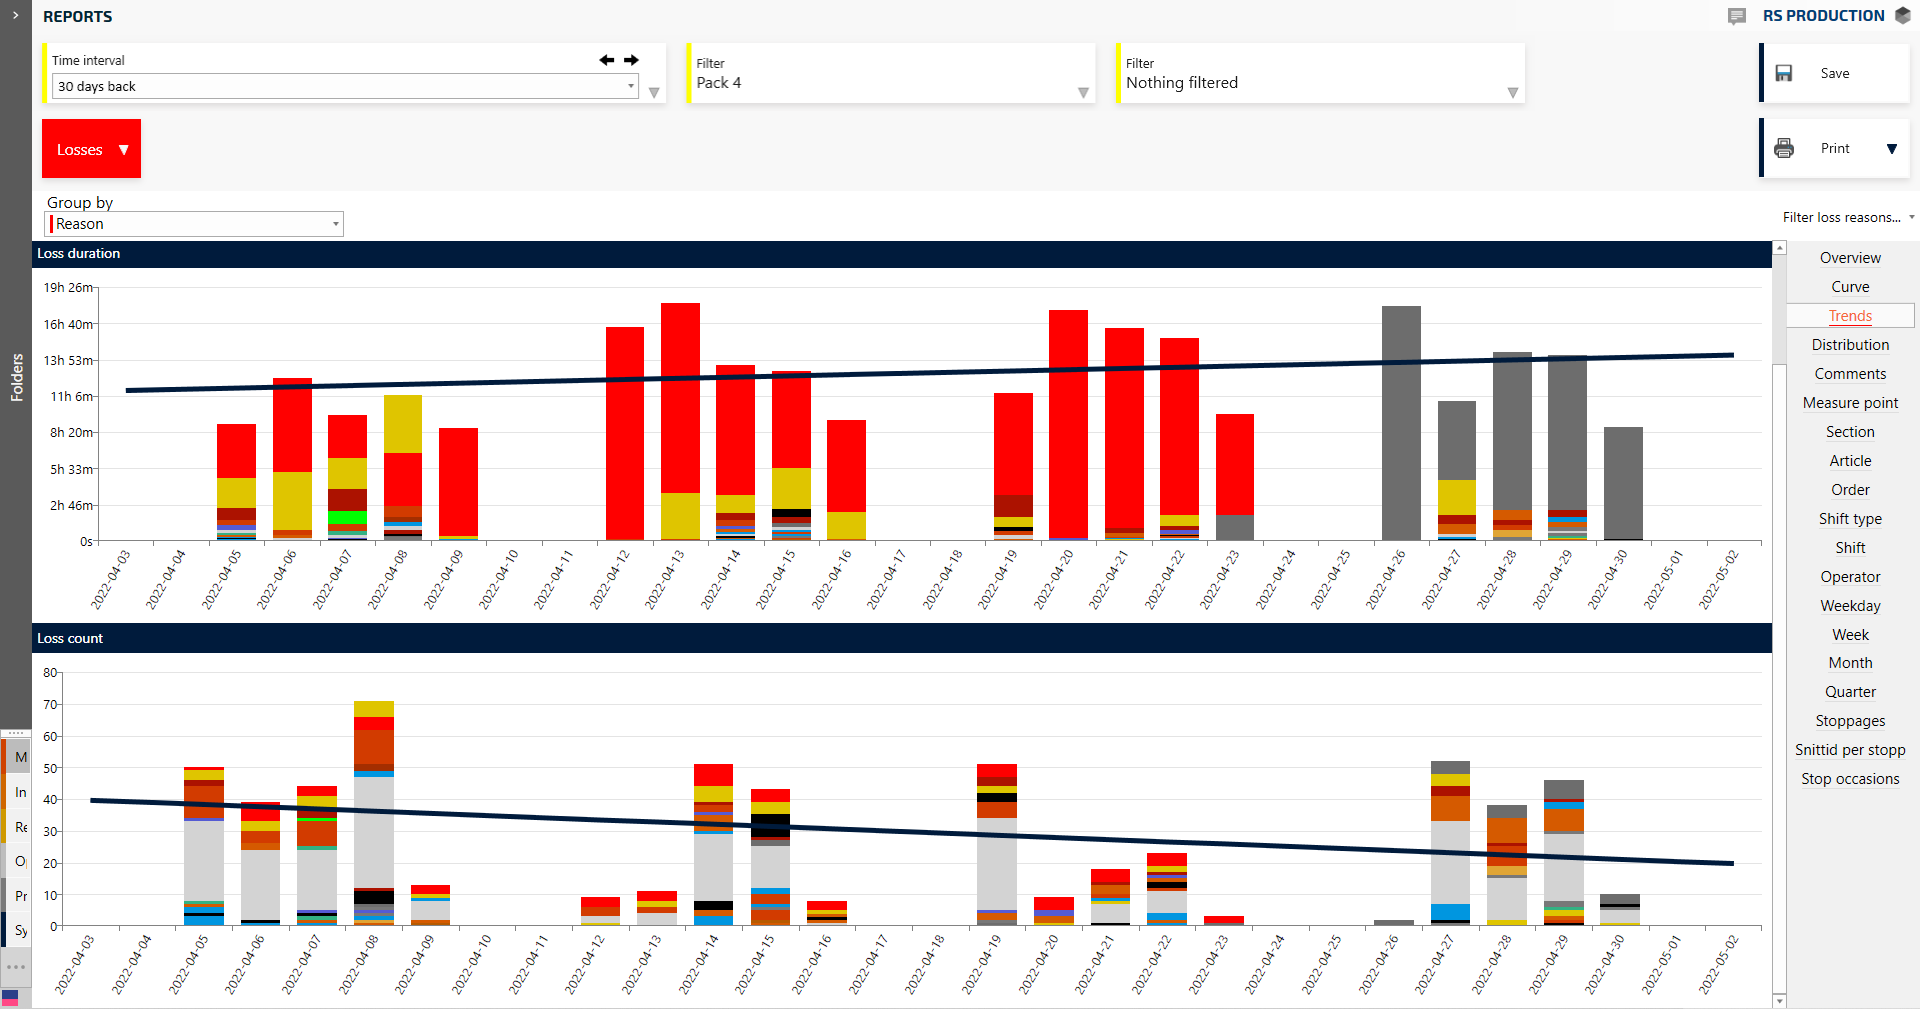
Follow the development of losses over time.
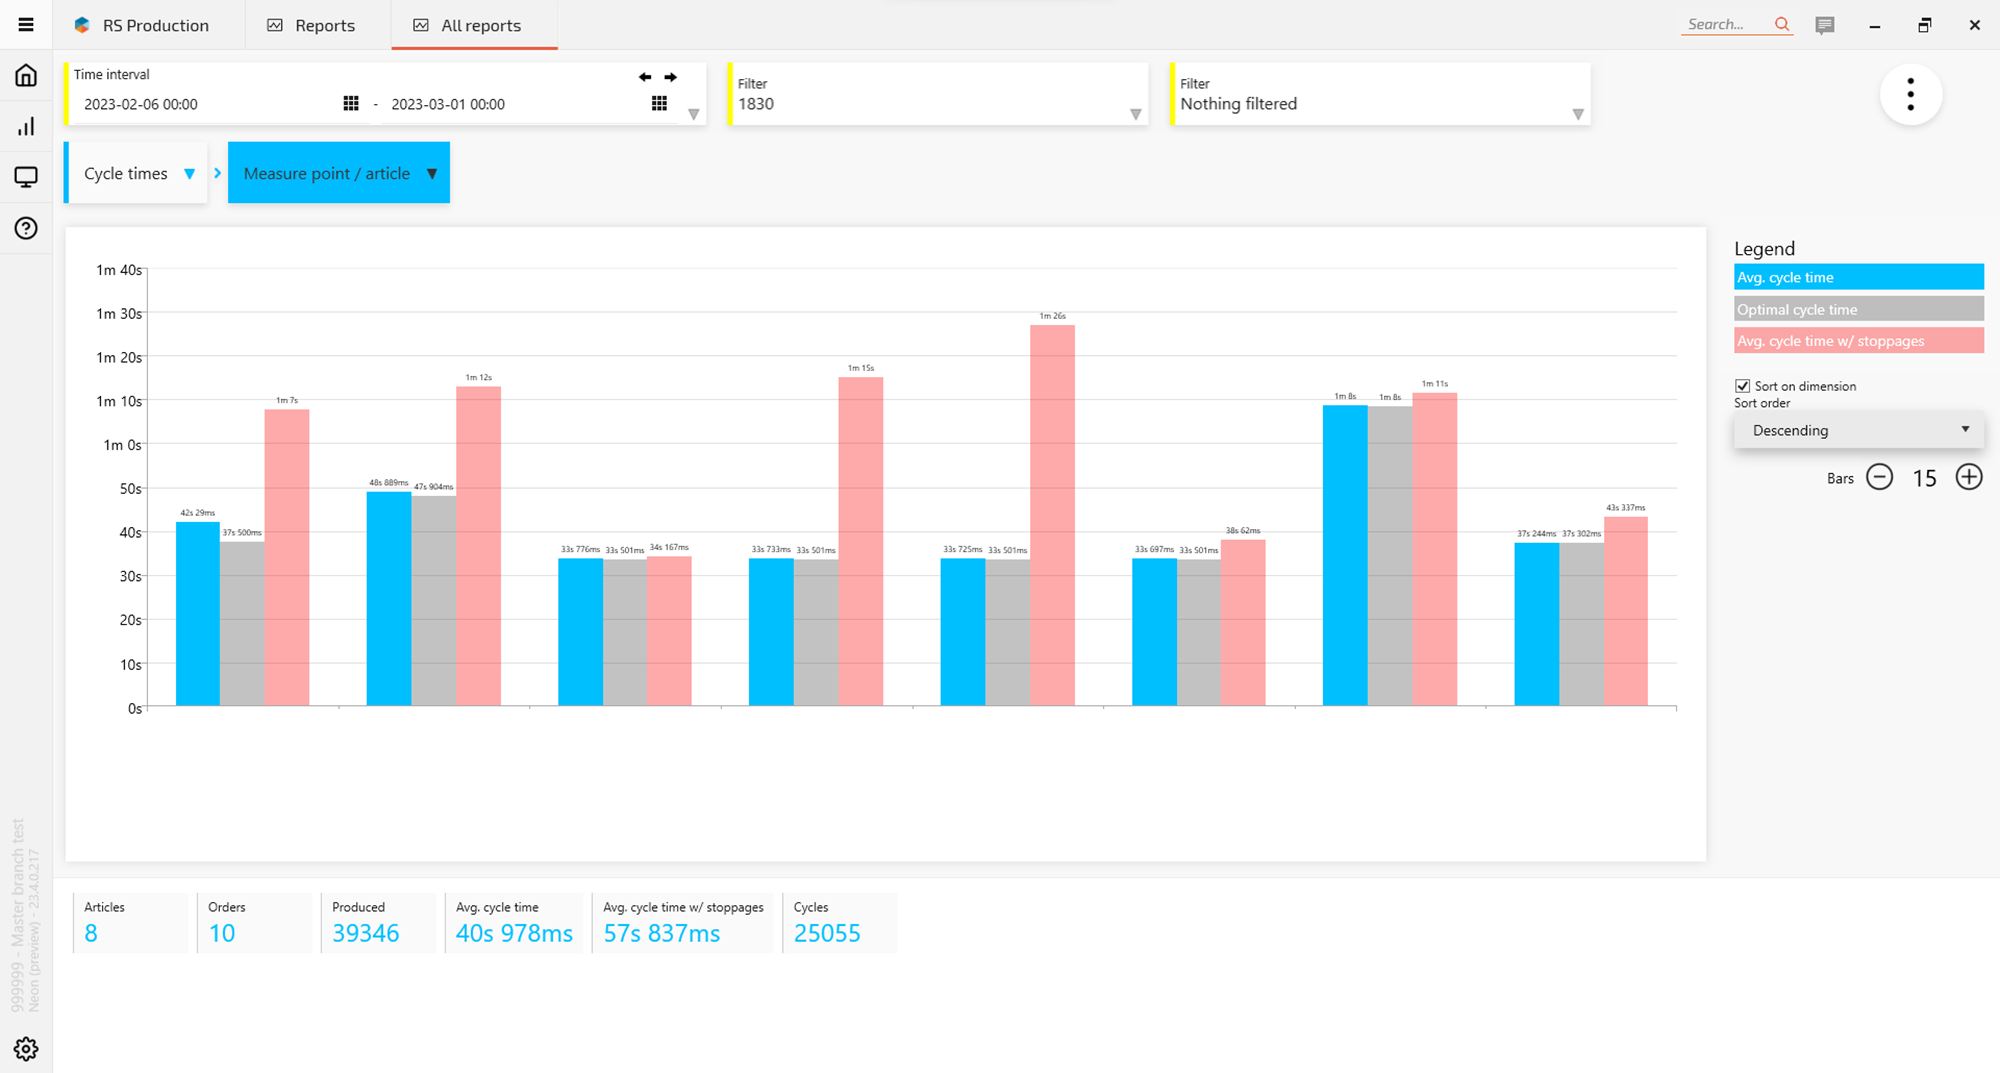
The cycle time analysis shows the true cycle times and efficiency factors to use in planning and cost calculations.
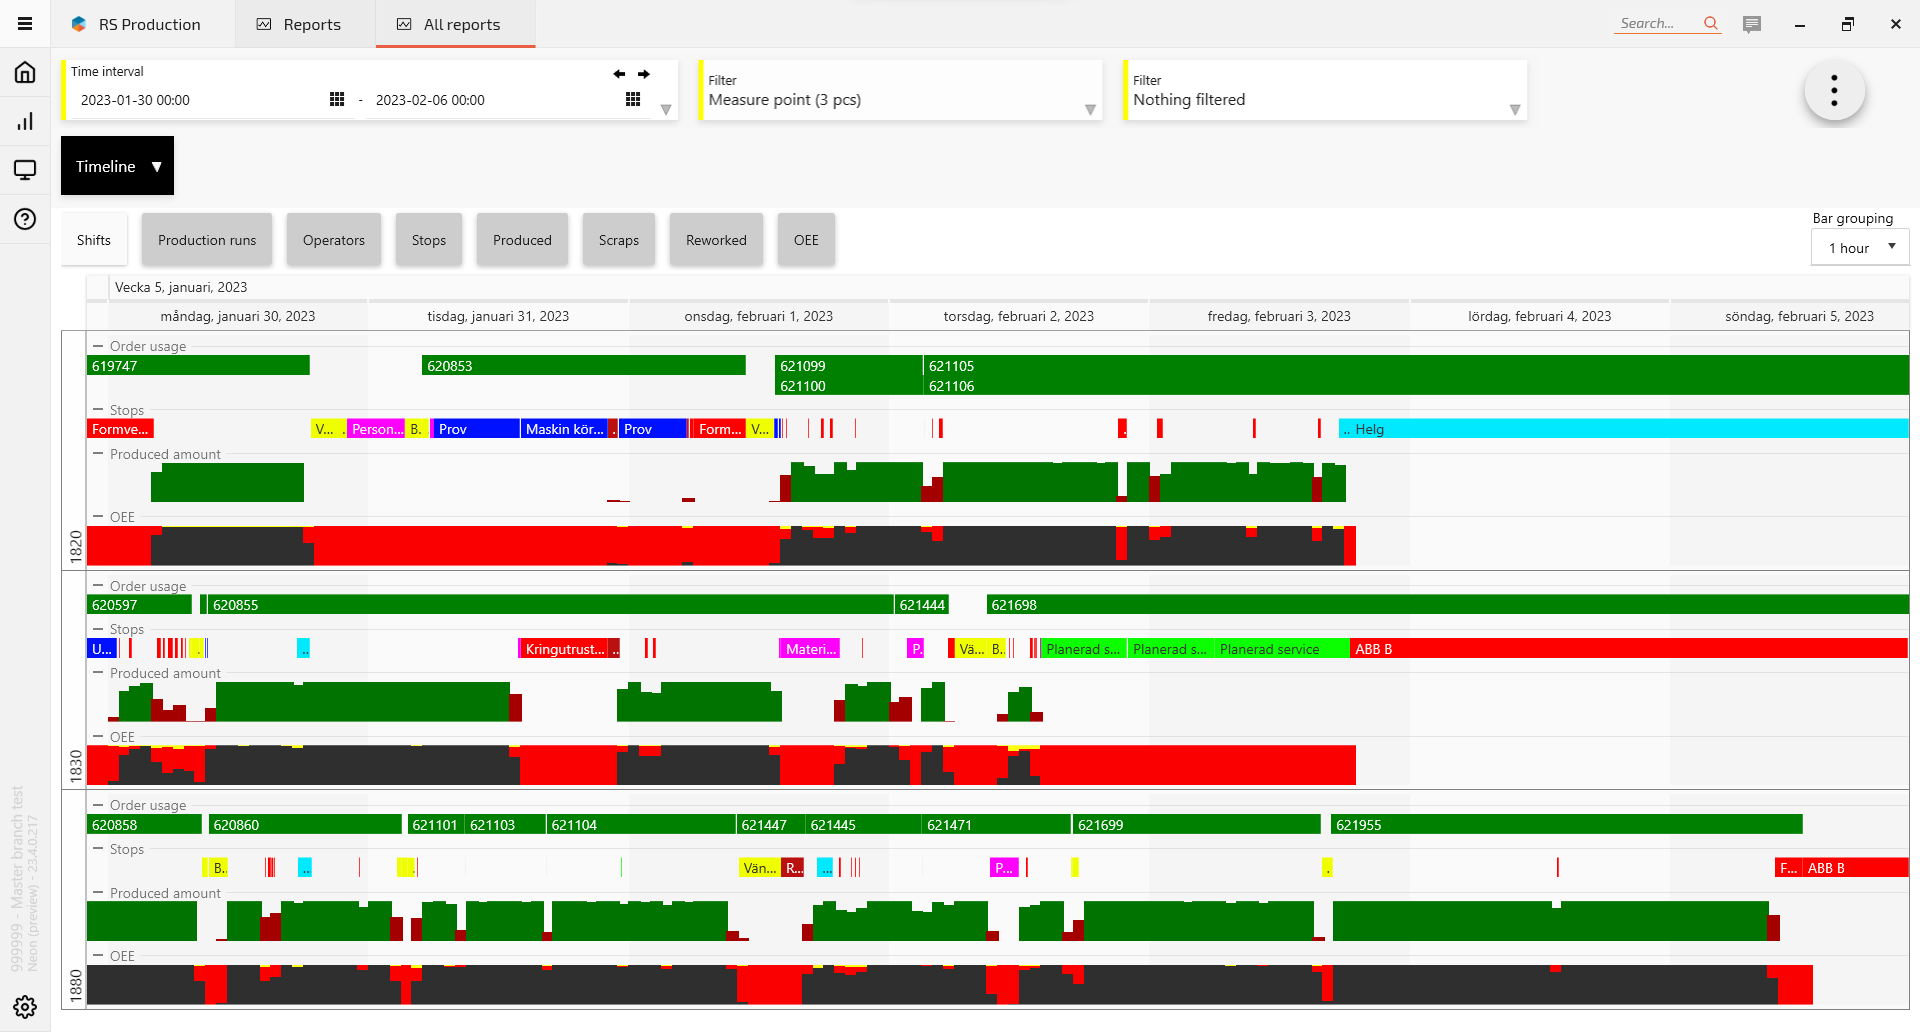
The real time timeline report adds transparency and tells exactly when something happened.
Office tools
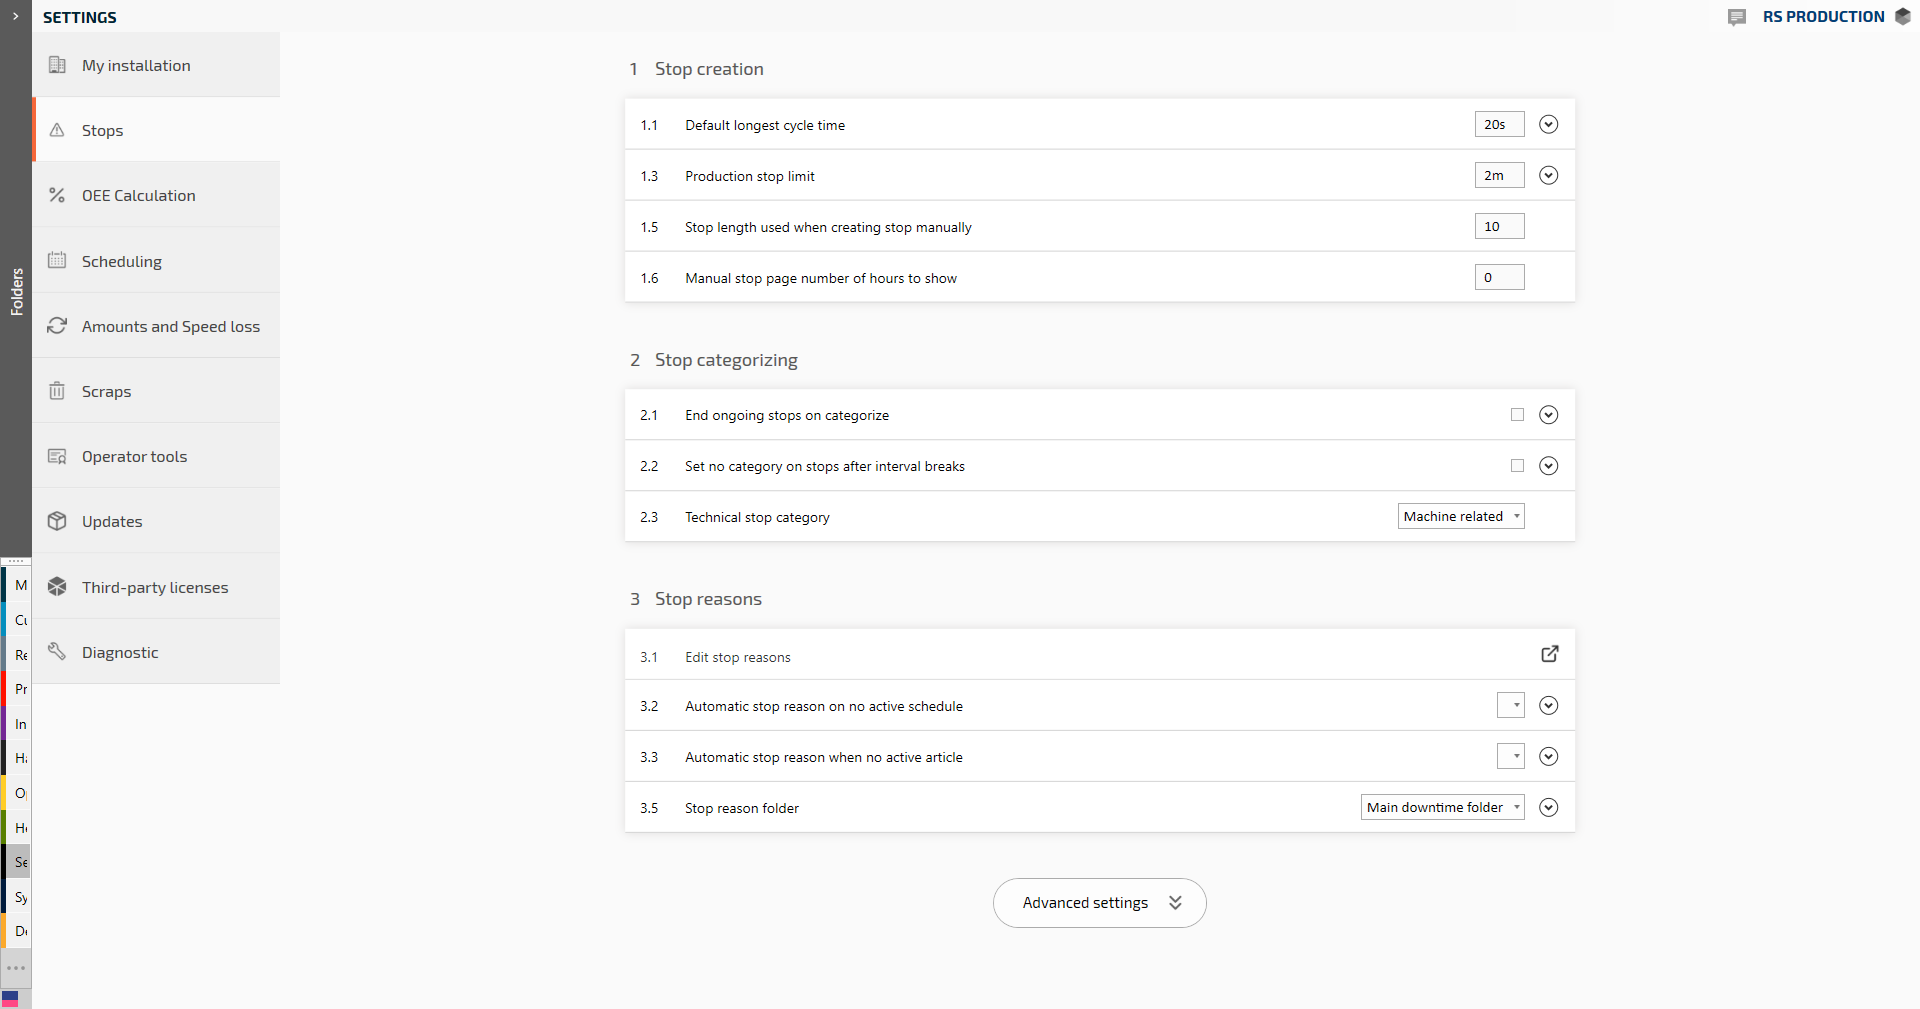
Easy to use settings interface to help you to have a system that is up to date with your needs.
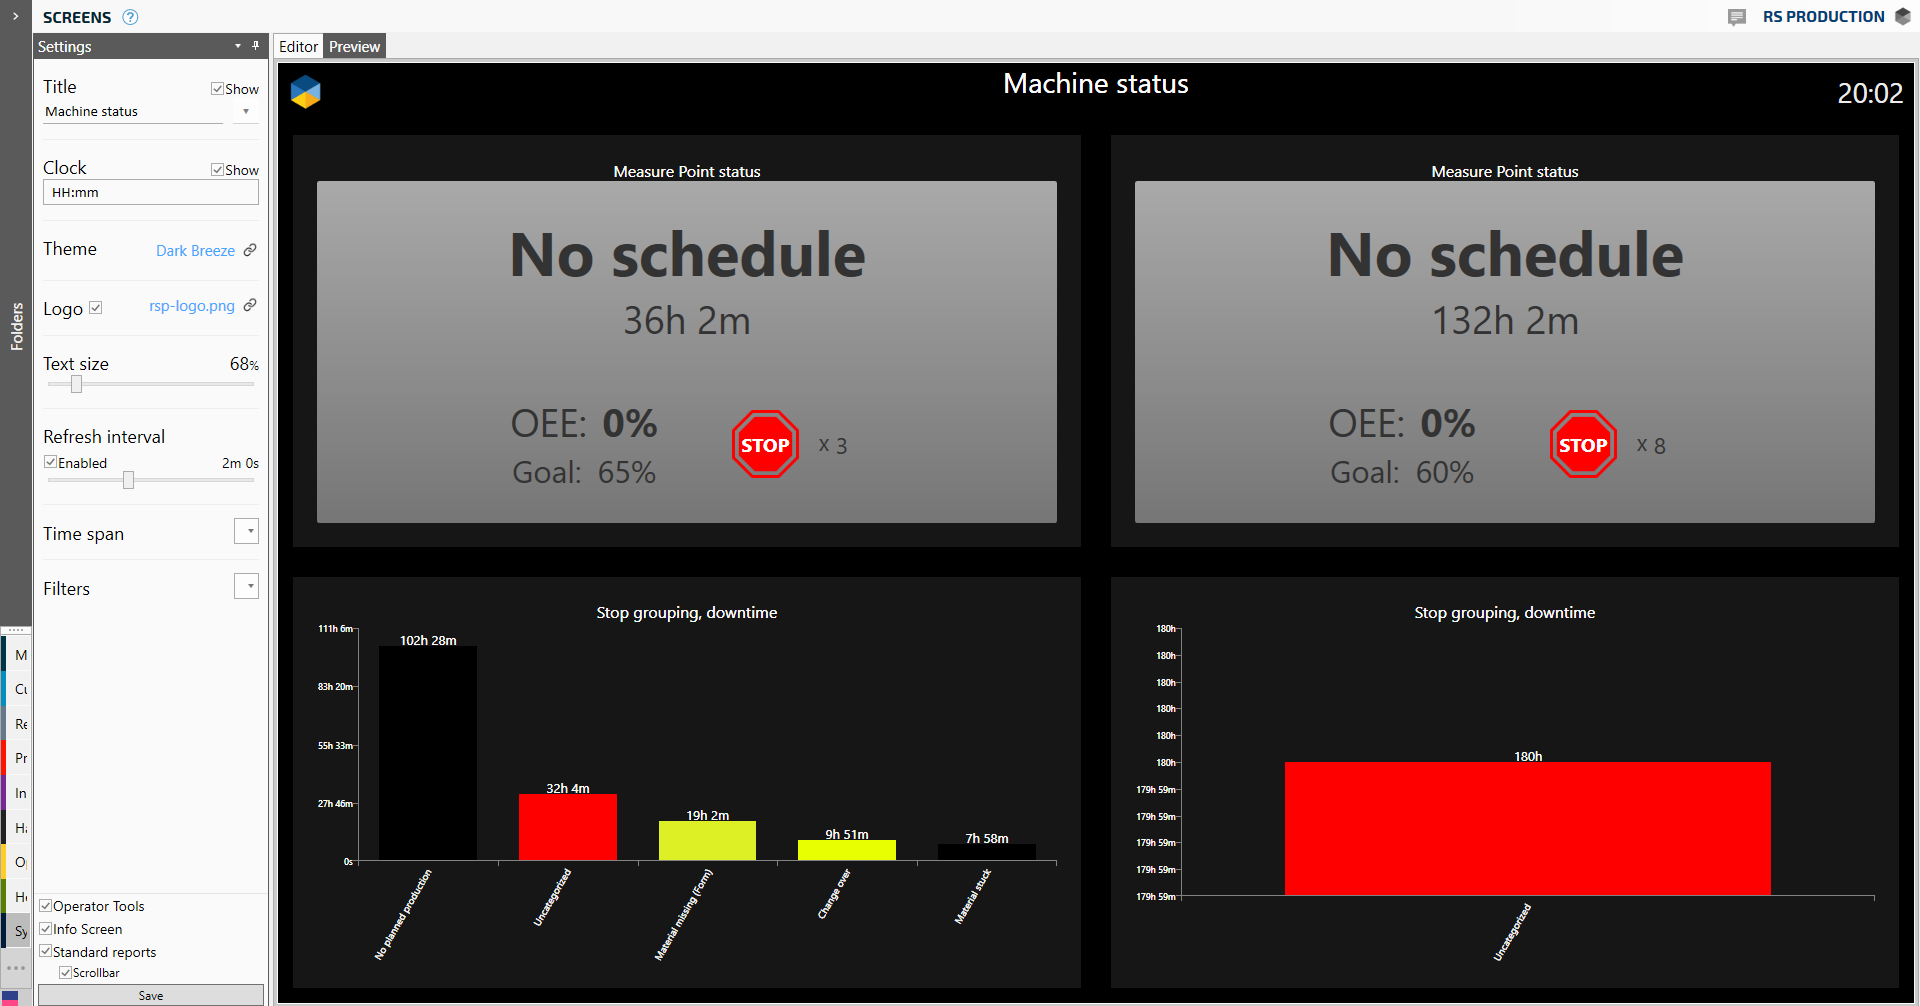
Use the Screens tool to configure your own report pages with no code writing. Select from +30 different visual standard components and adjust the dashboards when your teams need for facts changes over time.
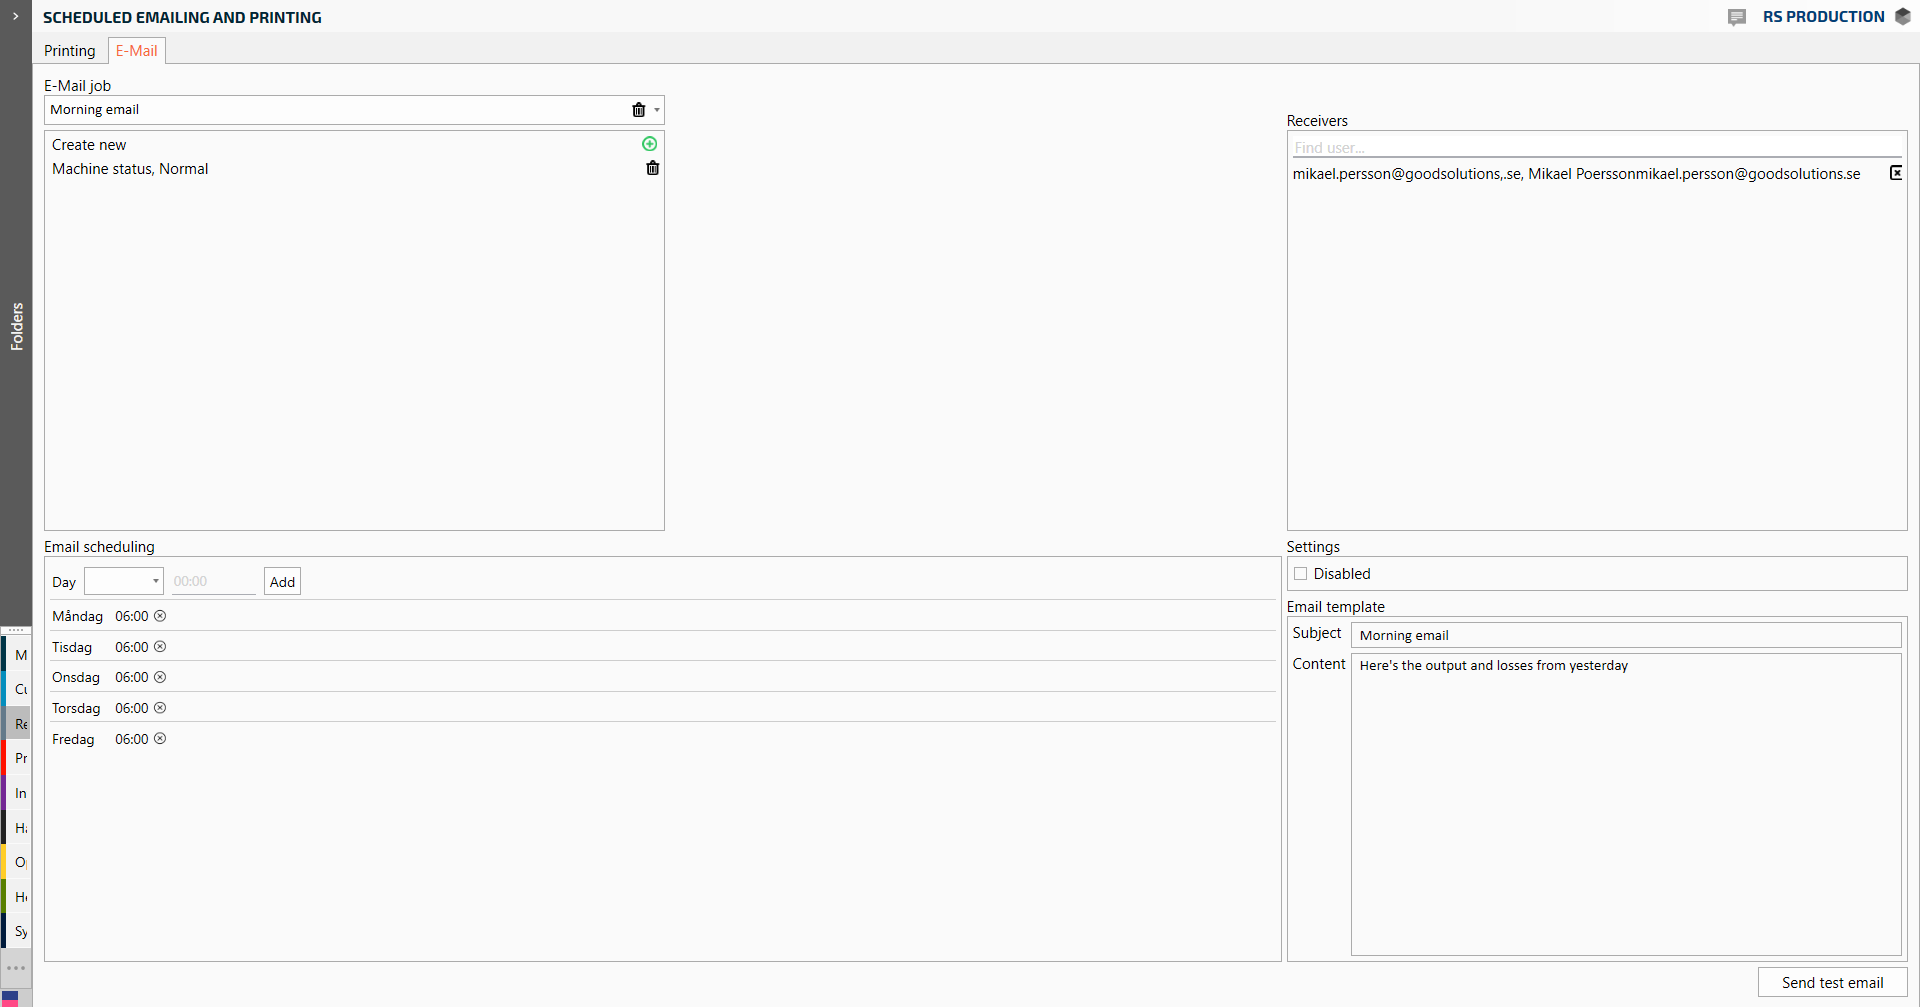
Support different roles and meetings with facts automatically with scheduled emails and print-outs.
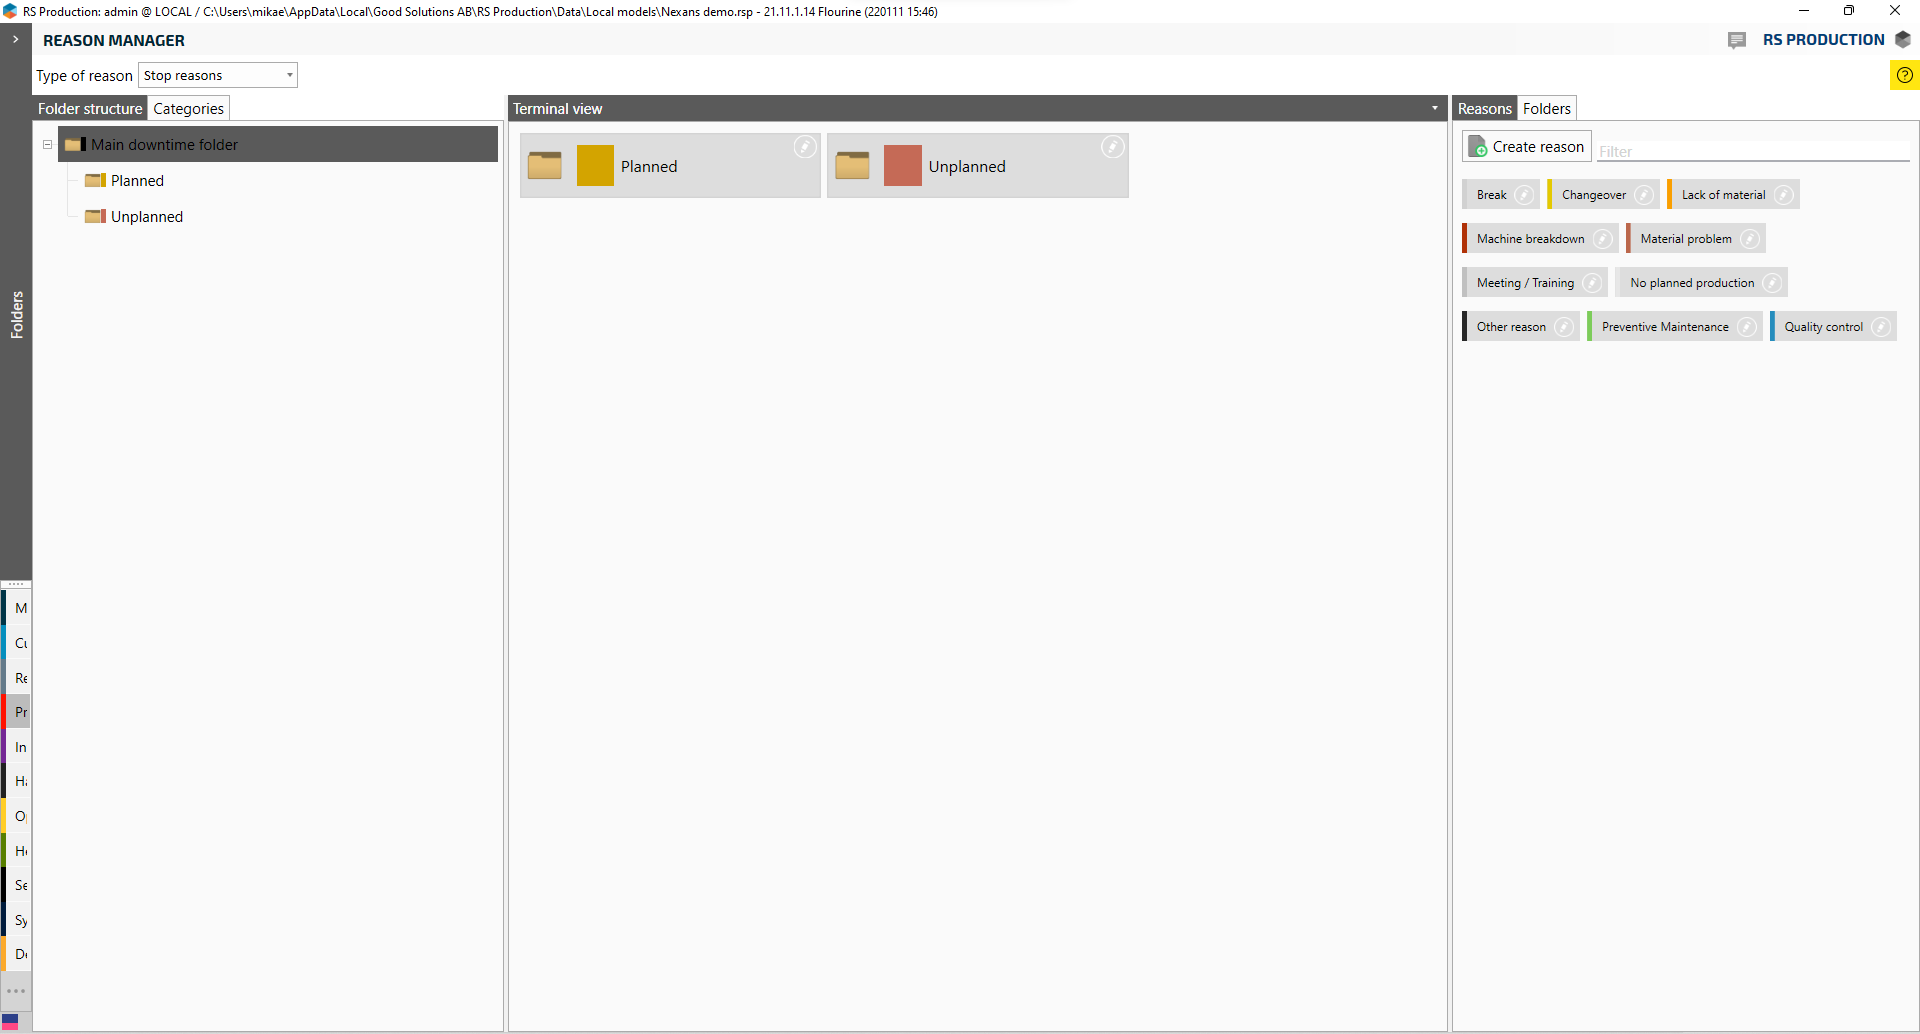
The visual reason manager helps to setup and maintain reason codes for downtime, speedloss, scrap and speed loss. Assign different reason codes to different machines and types of production processes. Group reason codes in categories to get a high level overview.
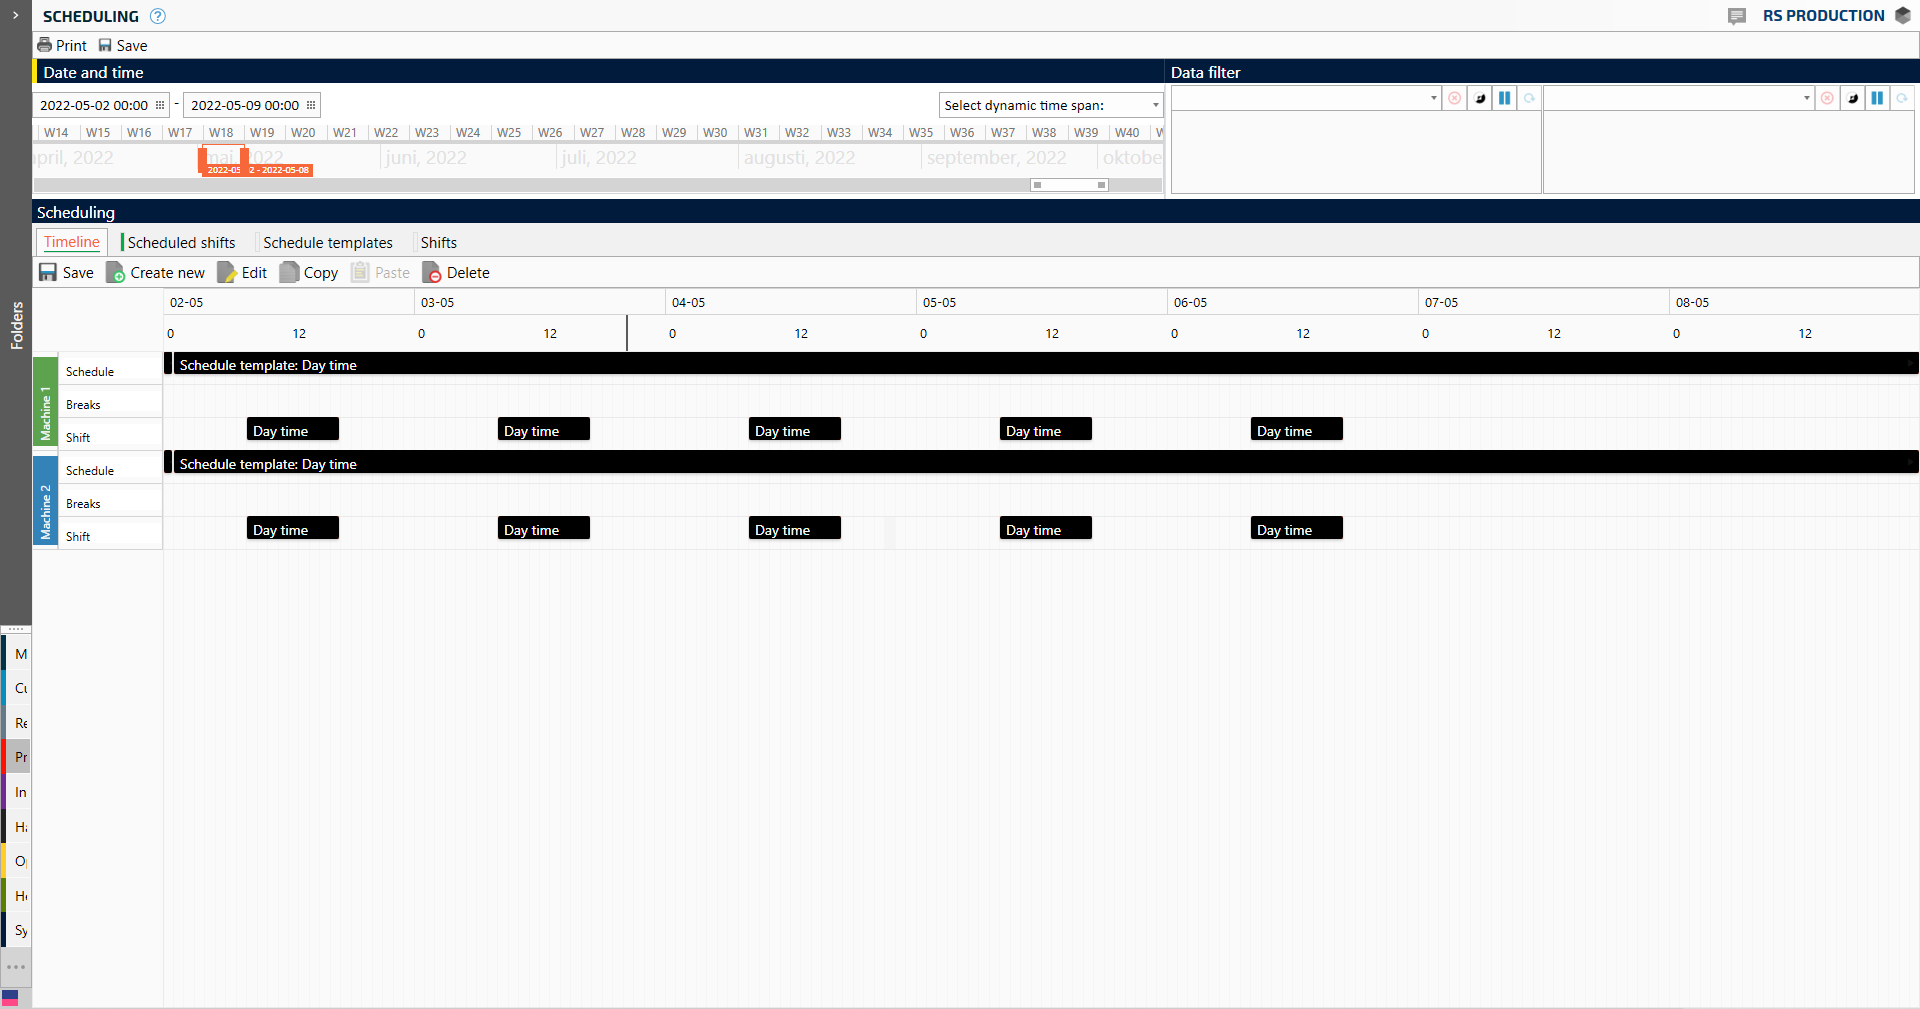
Use the visual scheduling to define shift schedules and machine time calendar. Automatic scheduling into the future. Handles breaks and planned shifts.