RS Production Screens
Screens is an addon for RS Production OEE and/or RS Production ACT.
A revolution for fact-based working methods
RS Production Screens gives you the right information at the right time in the right user interface. It drives faster reactions and reduced production losses.
RS Production Screens is a digital tool for creating participation and ownership by getting employees in different roles to work fact-based based on common current situation and problem images.
Without writing any code, you build your own real-time visualizations and report pages with a large selection of ready-made graphic components. This allows you to avoid expensive consulting costs and long lead times in future adjustments of visualizations.
With RS Production Screens, you can drive the right behaviors and decisions by showing the right information to the right person at the right time in the right user interface. It can be TV screens, e-mail, operator terminals or RS Productions' built-in report and analysis tools.
In an ever-changing world, reports and visualizations need to be constantly adjusted to remain relevant. In the easy-to-use interface in Office tools, you create, preview and publish the visualizations with a click-based configuration. This means that you provide the production organization with real-time updated decision material without writing a single line of program code.
And you adjust and adapt visualizations and reports on an ongoing basis without the need for help from product experts or external consultants.
Features
Put together and maintain your own visual report pages without coding.
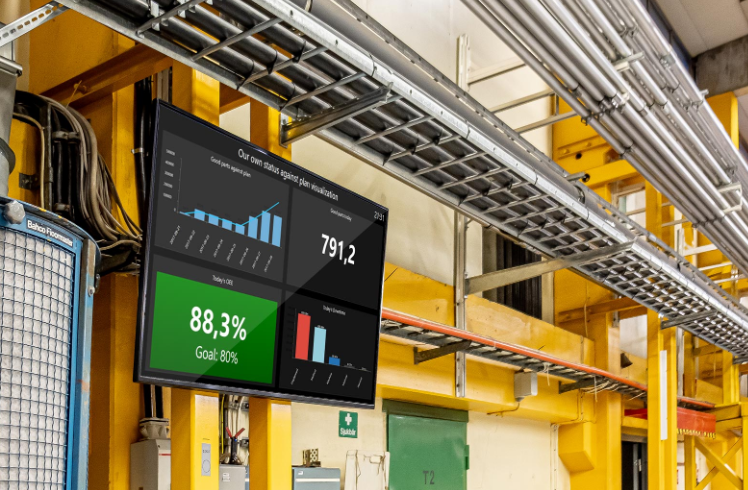
Report pages can be shown on
TV-screens (user interface Info Screens)
In Operator tools
In Office tools' report and analysis tool
Drag and drop standard components to show
Current status
Production outcome
OEE and losses
Standard visual Screens components
The different RS Production products and addons add their own Screens components.
Go here to read a Overview of screens components
User guide
Go here for RS Production Screens user guide
Examples
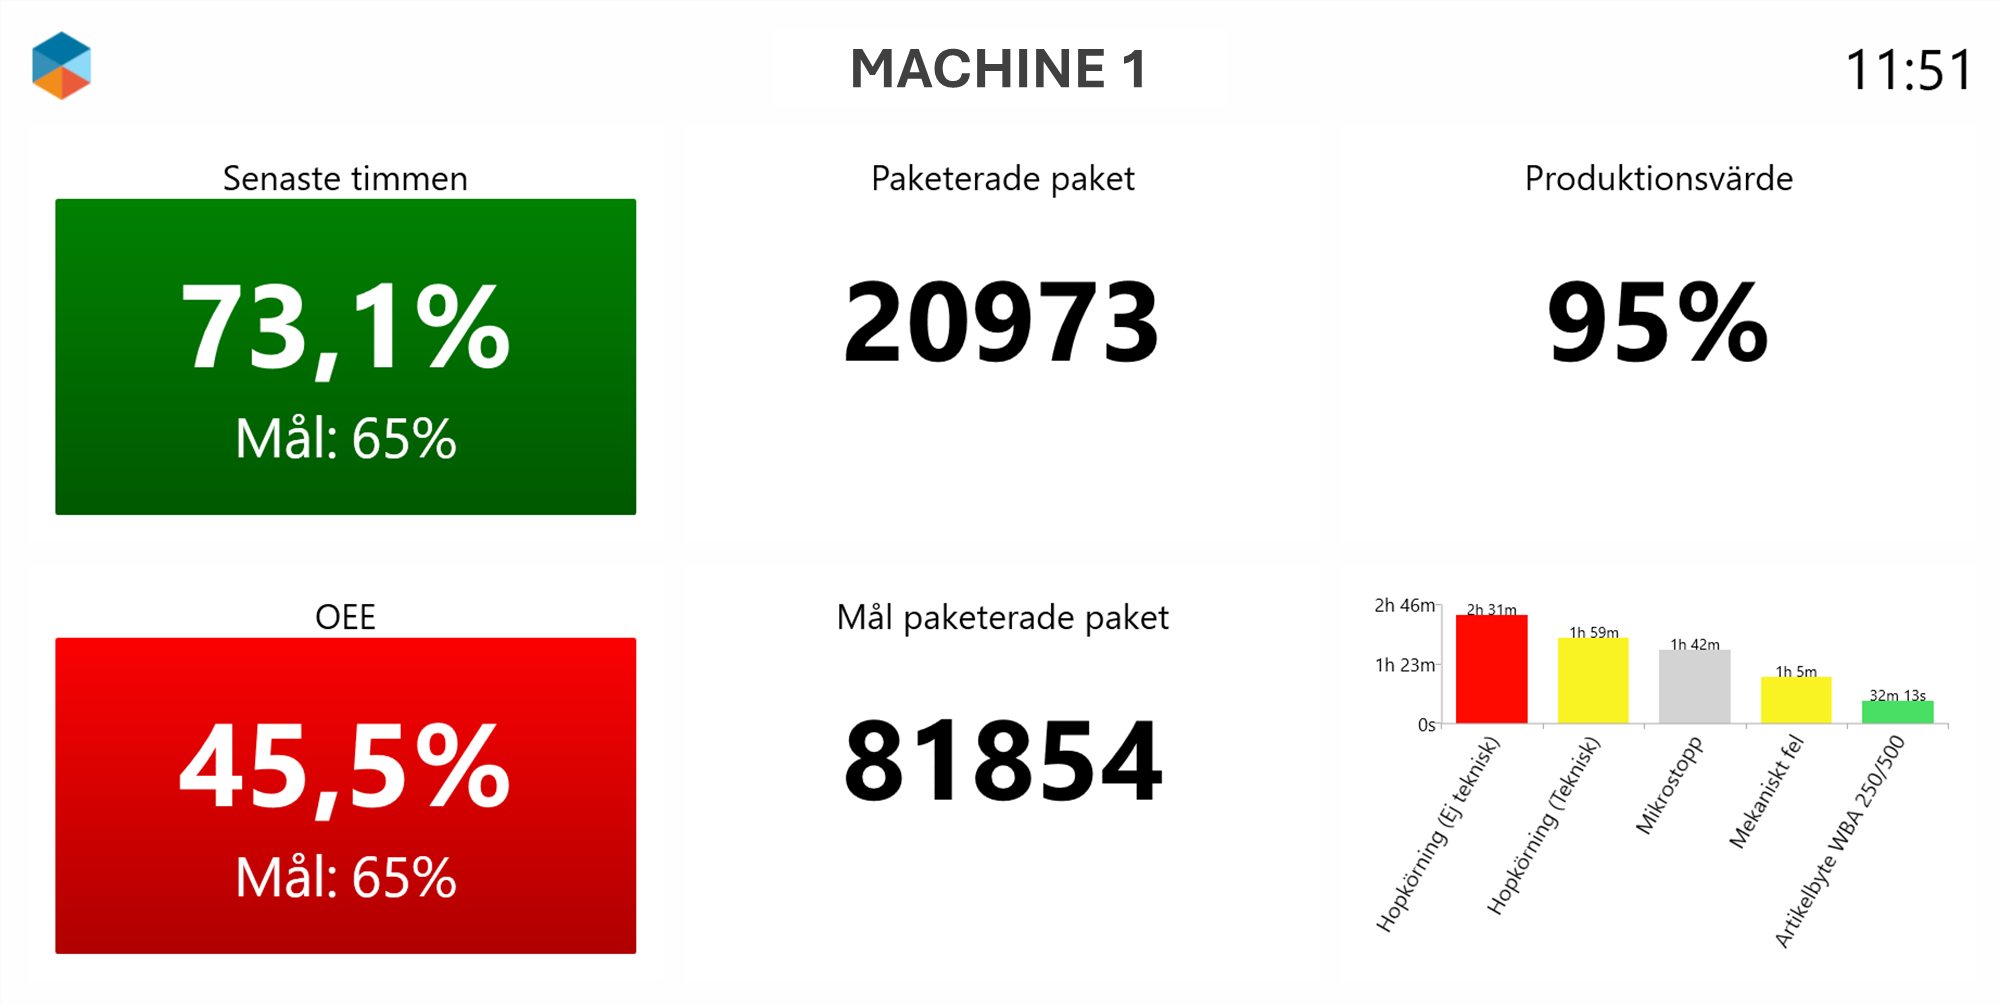
Single machine, cell or line
Last 60 minutes OEE, produced amount, uptime %
Ongoing 24h OEE, produced amount, top 5 loss reason
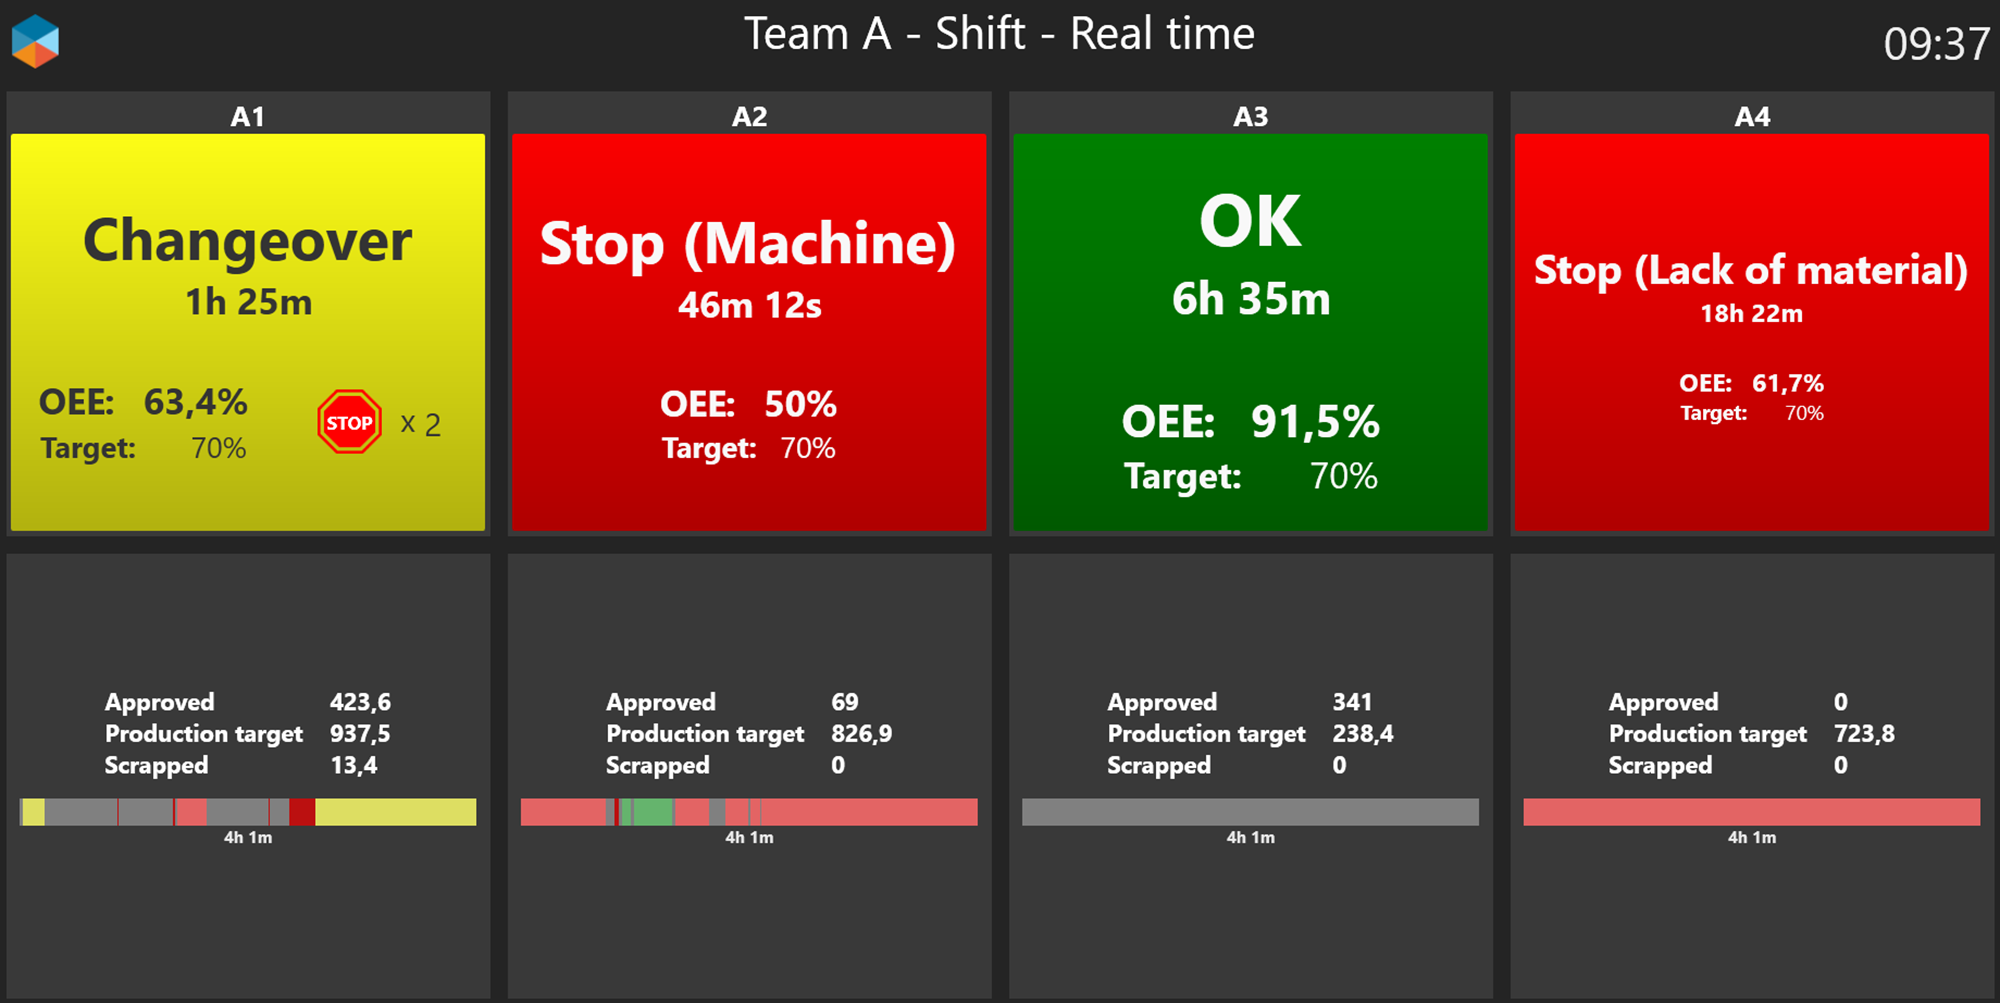
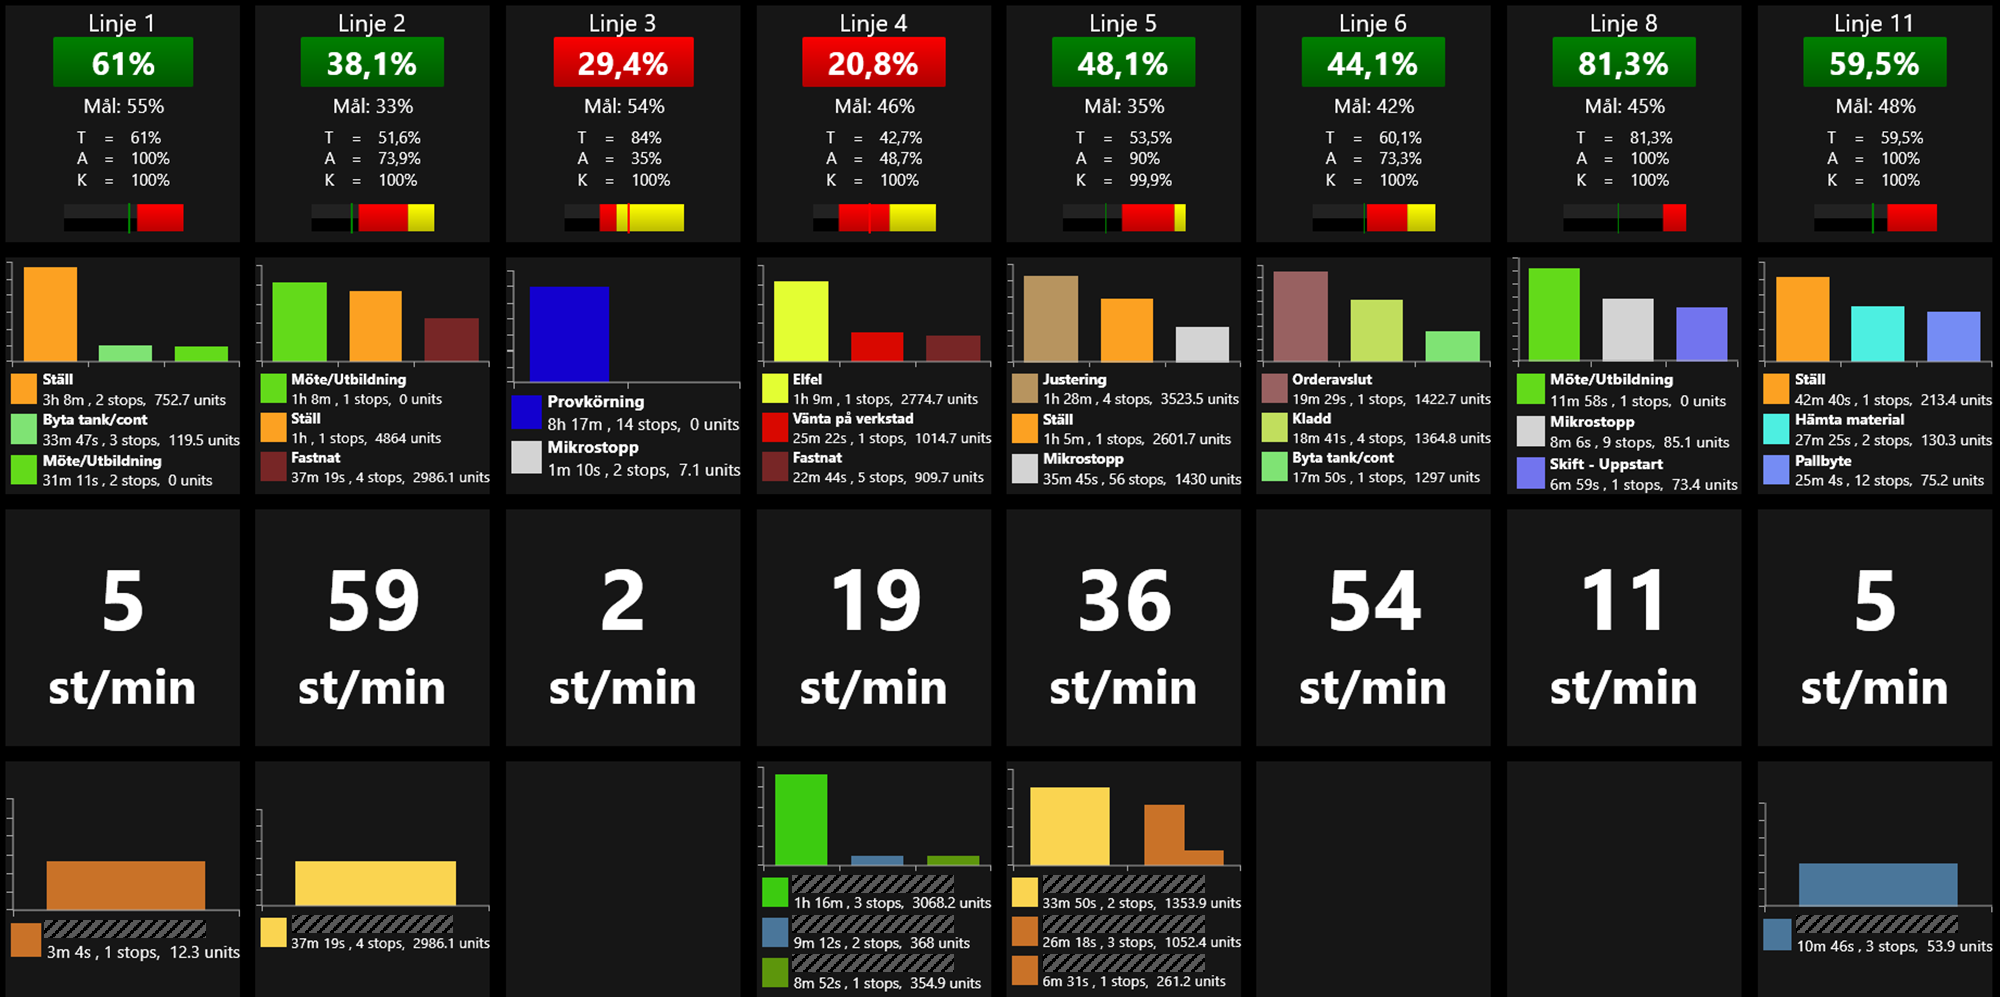
Machine group
Real time
Columns are Lines/cells/machines
Rows are
real time status (this shift) + no of stops without a reason code
produced + scrapped vs target + shift time line
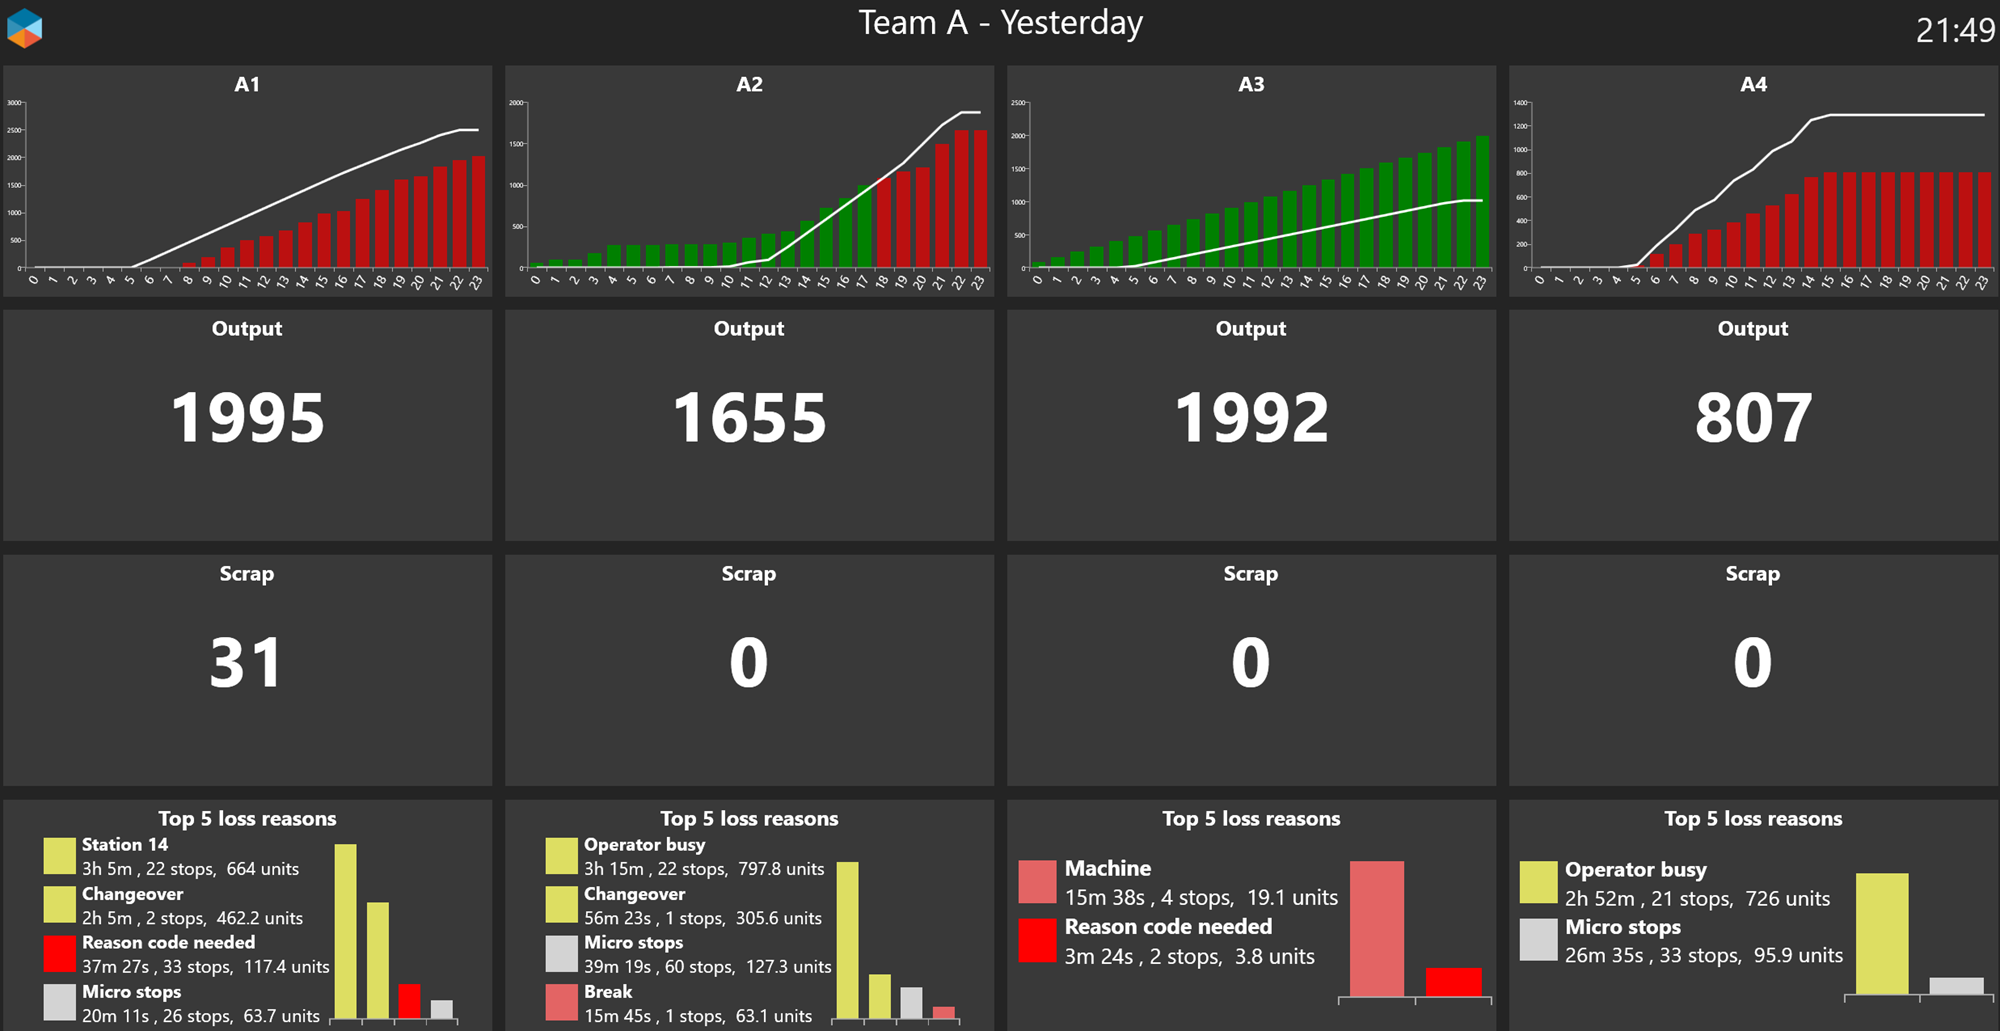
Daily summary
Columns are Lines/cells/machines
Rows are
approved amount vs target per hour
total approved amount
total scrapped amount
top 5 loss reason codes (time lost, no of stops, potential output lost)
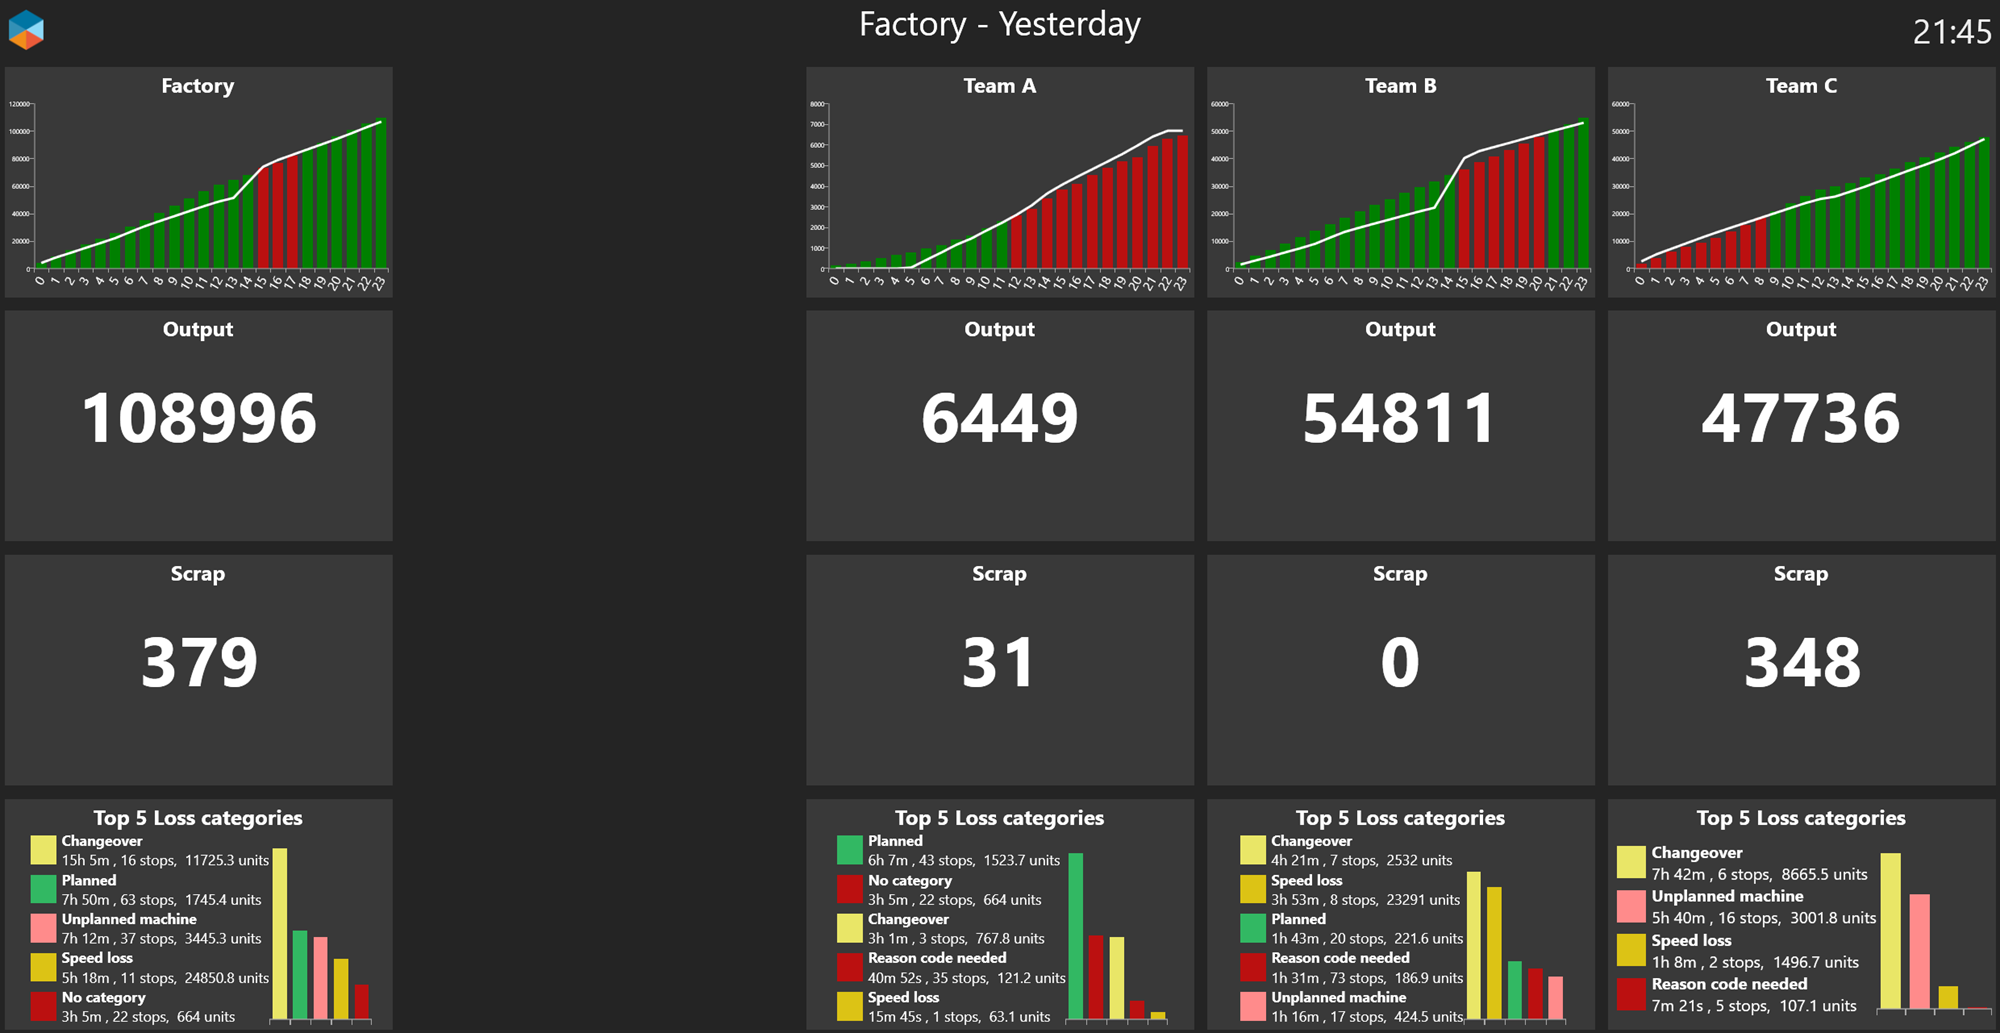
Full factory overview
Daily management
Columns are lines/cells/machines
Rows are
OEE vs target (incl breakdown into A/P/Q and OEE bar graph)
top 3 downtime reason codes (time lost, no of stops, potential output lost)
current machine speed
top 3 technical downtime reasons
Columns
Left column is full factory aggregated
Other columns are departments/teams/machine groups
Rows are
approved amount vs target per hour
total approved amount
total scrapped amount
top 5 loss reason categories (time lost, no of stops, potential output lost)
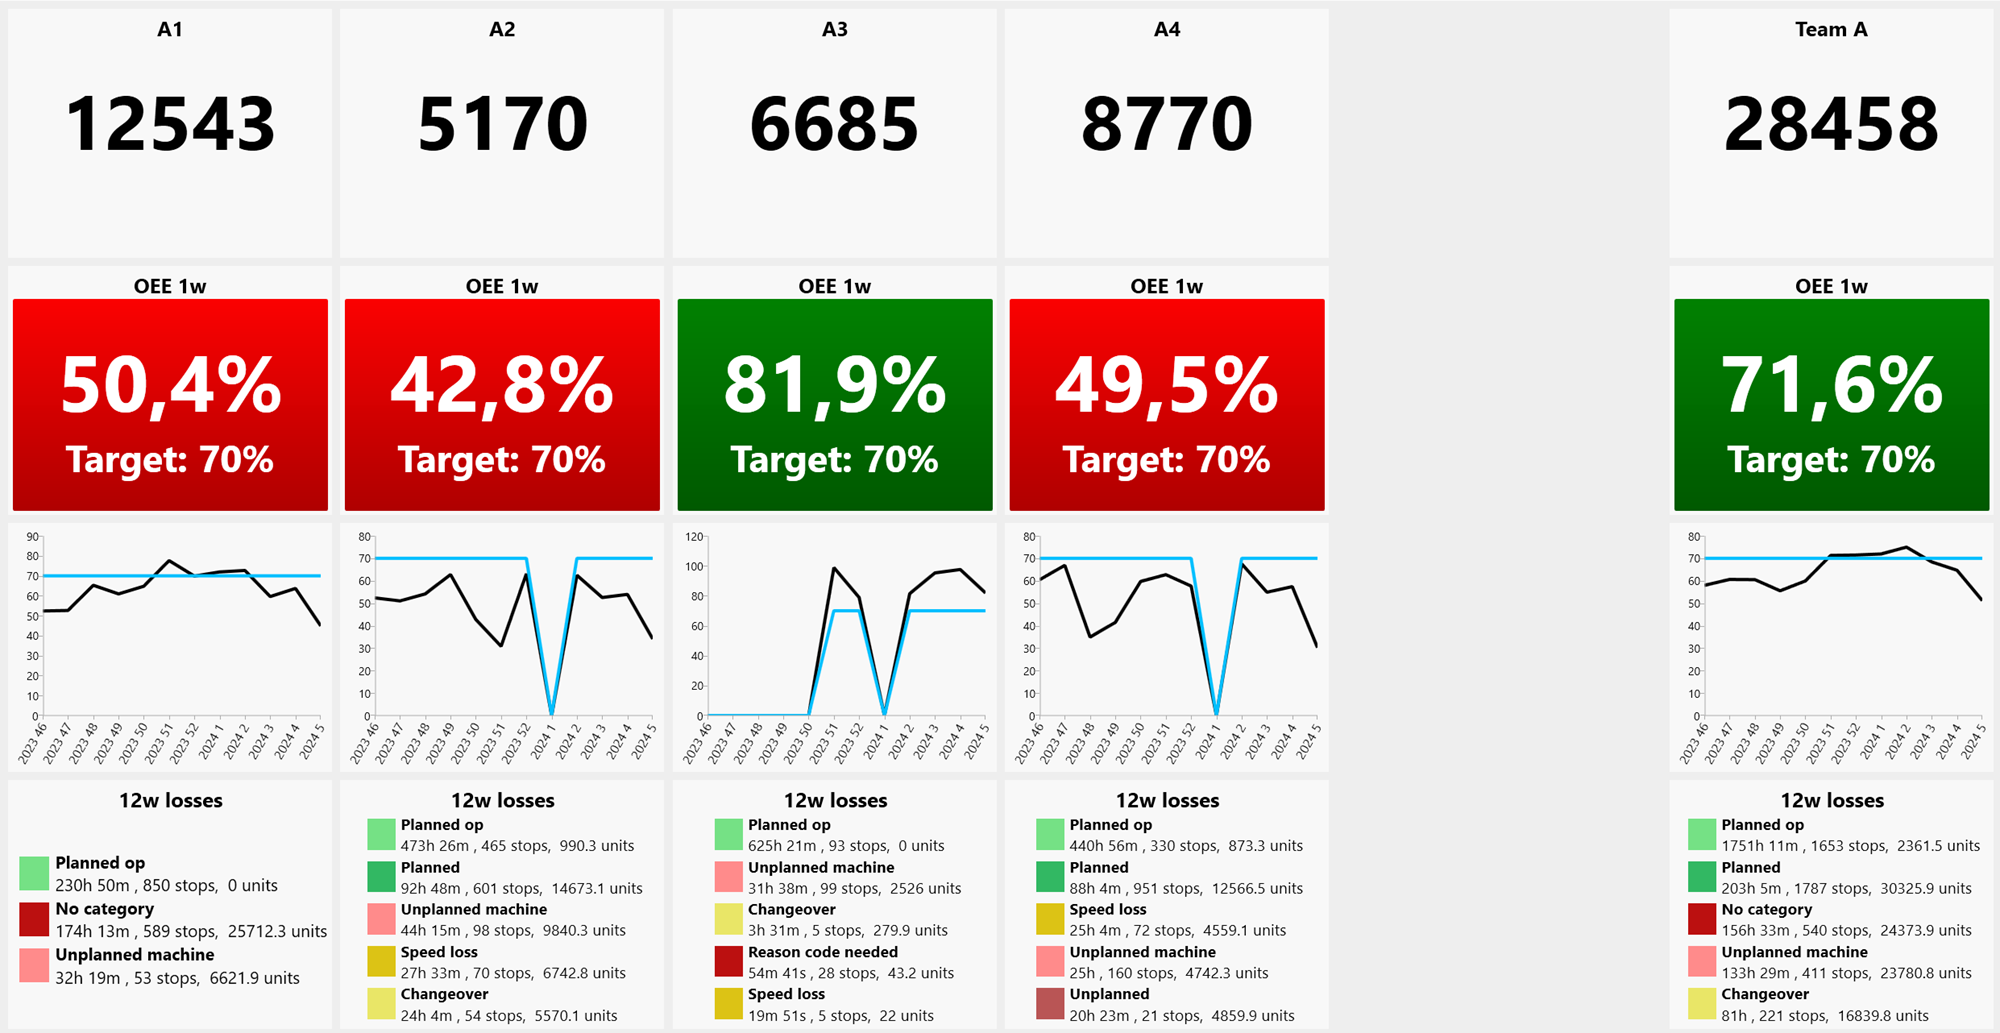
Weekly business review
Columns
departments/teams/machine groups
column to the right is full factory summary
Rows are
Output (amount that can be delivered to customer)
OEE vs target (explains cost level)
OEE per week last 12 weeks (explains cost development over time)
Loss reason categories (not reasons) last 12 weeks.
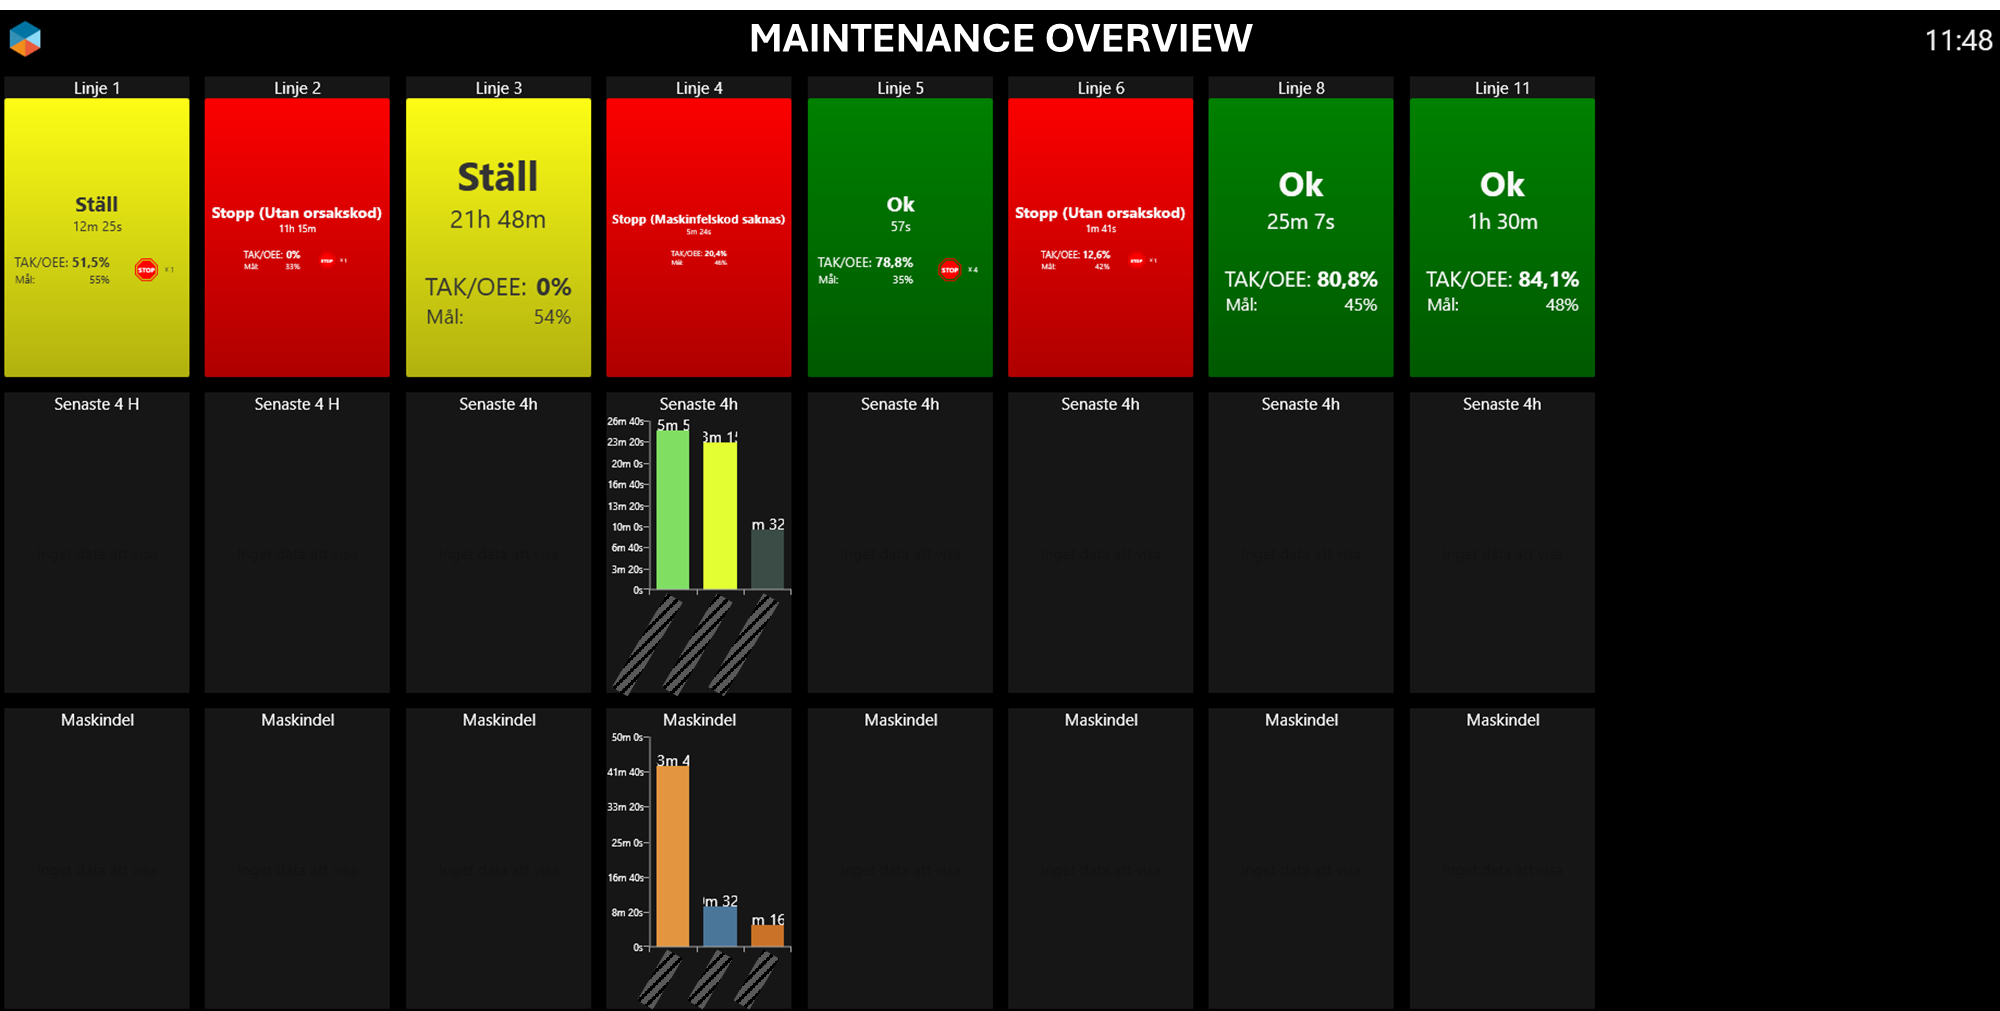
Maintenance
Full factory overview in real time
Columns are lines/cells/machines
Rows are
current machine status. Red if standing still.
technical loss reason codes last 4h
technical equipment/station loss codes last 4h.