RS Production Operator tools user interface
The Operator tools user interface is designed to easy use. It works well on touch panel Windows PC, laptop and stationary Windows PC.

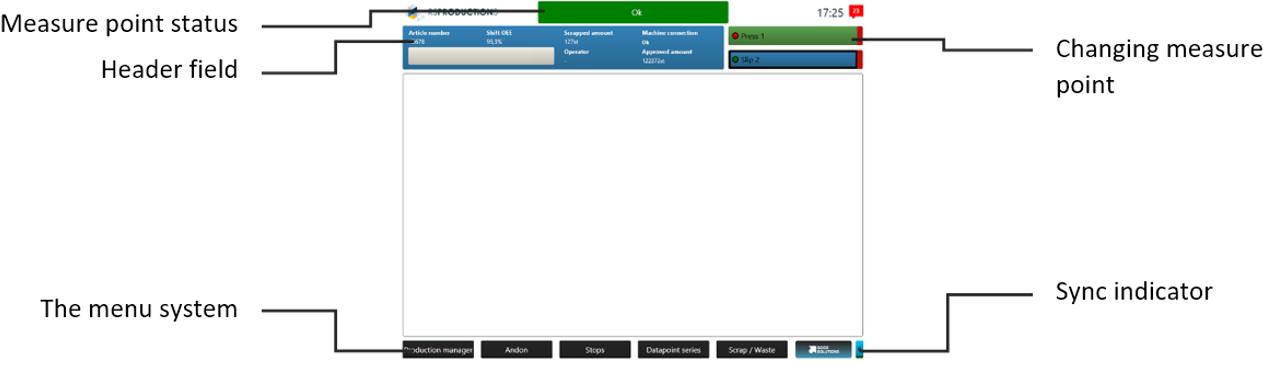
Overview
Go to Superuser's guide to RS Production Operator tools to get all details about settings and configurations for Operator tools.
Header fields
There is space for up to six header fields.
Field |
Approved amount |
Article name |
Article number |
Calculated end time |
Machine connection |
Operator |
Order number |
Ordered amount |
Produced units |
Scrapped amount |
Shift |
Velocity |
Changing measure point
Top right in Operator tools you can switch between the various measure points.
The first time you start Operator tools on a PC you can select which measure points you want to be able to select. In Office tools you can add and remove measure points that you can select.
Measure point status
In the Centre of Operator tools at the top, the current status of the measure point is shown. A measure point always has one of five statuses (Ok/uptime, stop, changeover, no active order, no schedule).
Operator tools pages and the menu system
The following pages are available in Operator tools.
Page | Product |
Andon | Addon Andon |
Production plan (order) | RS Production OEE, RS Production ACT |
Production plan (article) | RS Production OEE, RS Production ACT |
Article settings | RS Production OEE, RS Production ACT |
Latest article | RS Production OEE, RS Production ACT |
Downtime | RS Production OEE |
Manual downtime | RS Production OEE |
Latest stops | RS Production OEE |
Speed loss | RS Production OEE |
Scrap | RS Production OEE |
Rework | RS Production OEE |
Shift report | RS Production OEE |
Shift report pareto | RS Production OEE |
Production report | RS Production OEE |
Forms | RS Production ACT |
Documents | RS Production ACT |
Data Series | Addon Stable Processes |
ERP-reporting | Addon Integration Interface |
Track and Trace | Addon Track and Trace |
Stable Processes | Addon Stable Processes |
Changeover | RS Production OEE |
Momentaneous | RS Production OEE |
At the bottom in Operator tools is a row of menu buttons where you switch between different pages. It is called the “five menu” of historical reasons.
In Office tools you can set which buttons you want to have in your menu. A useful tip is not to have more than absolutely necessary. A straightforward user interface is important if manual data collection is to function as well as possible.
Giving stops a reason code
Stop reason coding is one of the central functions in RS Production. A more in-depth description of how downtime and speed loss work in RS Production is available here.
The left-hand column on the Stop coding page shows the eight last stops. The right-hand column shows older stops that are still uncategorized.
For each stop, the time when the stop occurred is shown, as well as its length and the reason code the stop was given.
An ongoing stop row has a dotted border around it and a clock symbol showing that time is passing.
At the top right of the stop row is a button to enter comments in free text. The button is grey until a comment is entered. Once there is a comment, the button is green.
When a stop first occurs, a white “micro stop” is displayed until enough time has passed to cross the threshold for a production stoppage. At this point it changes to a red “uncategorized” stop.
The stop is red “uncategorized” until the operator clicks on it and selects a reason code (and where applicable a station code as well). At this point, it changes to a grey “categorized” stop.
There is a threshold value “shortest stop displayed in terminal” that can be used to control how long stops must last before they are displayed in Operator tools. This is set in Office tools.
White “micro stops” can also be categorized.
Stops that occur in connection with an order/article change are automatically categorized as yellow “changeover time” and then linked to the reason code selected for “changeover”.
Stops that occur in connection with not having any order/article active are automatically categorized as orange “no active order” and then linked to the reason code selected for “no active order”.
Stops that have been automatically categorized turn grey immediately with a reason code (and, where applicable, station).
You can at any time click on a stop that has already been categorized and give it a different reason code (and where applicable a station code).
There is a setting for controlling whether stops that are outside the schedule should be displayed. This gives the operators the opportunity to work overtime and specify stop reasons exactly as they would usually do. A schedule can always be adjusted afterwards. A stop outside a schedule is then displayed as dimmed red “uncategorized”, to show that it differs from an ordinary red “uncategorized”.
There is a setting for controlling whether a new stop should be created when an ongoing stop lasts beyond a shift change.
Registering scrap
Normally you have the scrap button in the menu system.
Registered scrap affects the quality parameter in the OEE-value.
If you run several simultaneous orders/articles or ERP-connection, you can opt to have the scrap button for the ongoing order on the production plan page.
You register scrap by entering the amount to be scrapped and then selecting a reason on the right of the page. The most usual reason codes are shown there as hot keys. You can also select a different reason.
Registered scrap instances are displayed bottom left. When each scrap instance is registered, you will be able to see the amount that has been scrapped and the reason code specified.
You cannot scrap amounts that exceed the amount produced on that particular run.
To the right of the scrap row is a button to enter comments in free text. The button is grey until a comment is entered. Once there is a comment, the button is green.
Click on a scrap row to remove it.
If you have the scrap button in the menu system, you can scroll back to older runs and register scrap for them afterwards.
There is also a rework registration which you can add to the menu field. Rework affects the performance in the OEE-value instead of the quality outcome.
Production plan
The production plan page is where you specify which order you are to run. There you can adjust lots of parameters relating to cycle times.
The left-hand column contains the planned runs/articles that are available for you to start. Depending on whether you are running a more straightforward article run or an order run, a number of different fields are displayed specifying the order, article, ordered amount, planned start time etc.
Flexible buttons
In the right-hand column are the ongoing runs/articles. Depending on whether you are running a more straightforward article run or an order run, a number of different fields are displayed specifying the order, article, ordered amount, produced amount, scrapped amount, reworked amount, posted changeover time, measured changeover time, uptime, stop time, OEE, split time per cycle, earliest completed and estimated completed.
You can set the number of planned runs that are to be shown in the left-hand column.
You can set the number of simultaneous runs that are to be permitted in the right-hand column.
You can automatically activate completion of the previous run when you start a new run. This means that the end point for the first run will be the same as the start point for the second run.
If you have a large number of available planned runs or articles, you can activate a search field where you can specify order number, article number or article name so as to quickly find what it is you want to run.
See Super user’s guide to Operator tools for more details.
Shift report
The shift report is a real time snapshot of the outcome during the ongoing shift. You can scroll to previous shifts with the arrow buttons at the bottom of the page.
On the far right are buttons for showing more detailed stop information.
The button on the right-hand side is a logbook function where you can enter free text comments for the shift.
The shift report has five fact fields and three graphs.
Field | Contents |
Shift schedule |
|
Amounts |
|
Speed |
Please note that speed is calculated for the uptime, not the entire shift time or the order time |
Times |
|
Efficiency |
|
Stop reasons (top 5) | The shift’s five main stop reasons totalled for stop time |
Outcome per hour | Produced amount per hour. The line shows the hour’s calculated target. Target = OEE target x the article’s optimal cycle time
|
Cumulative outcome per hour | Totalled produced amount combined per hour. The line shows the target so far for the shift. Target = OEE target x the article’s optimal cycle time
|
Production report
There is also a “Production report” that shows times and amounts distributed by run (order/article) during the shift.