Loss model report
This report is a part of RS Production OEE.
How to use the loss model report?
Overall equipment effectiveness (OEE) can be visualized in many different ways, this is high level overview based on a standardized Time model for OEE for the selected time frame and data filtering.
If you want to start with the basics, read this introduction - What is OEE?.
See your factory’s overall equipment effectiveness (OEE) and find its hidden capacity
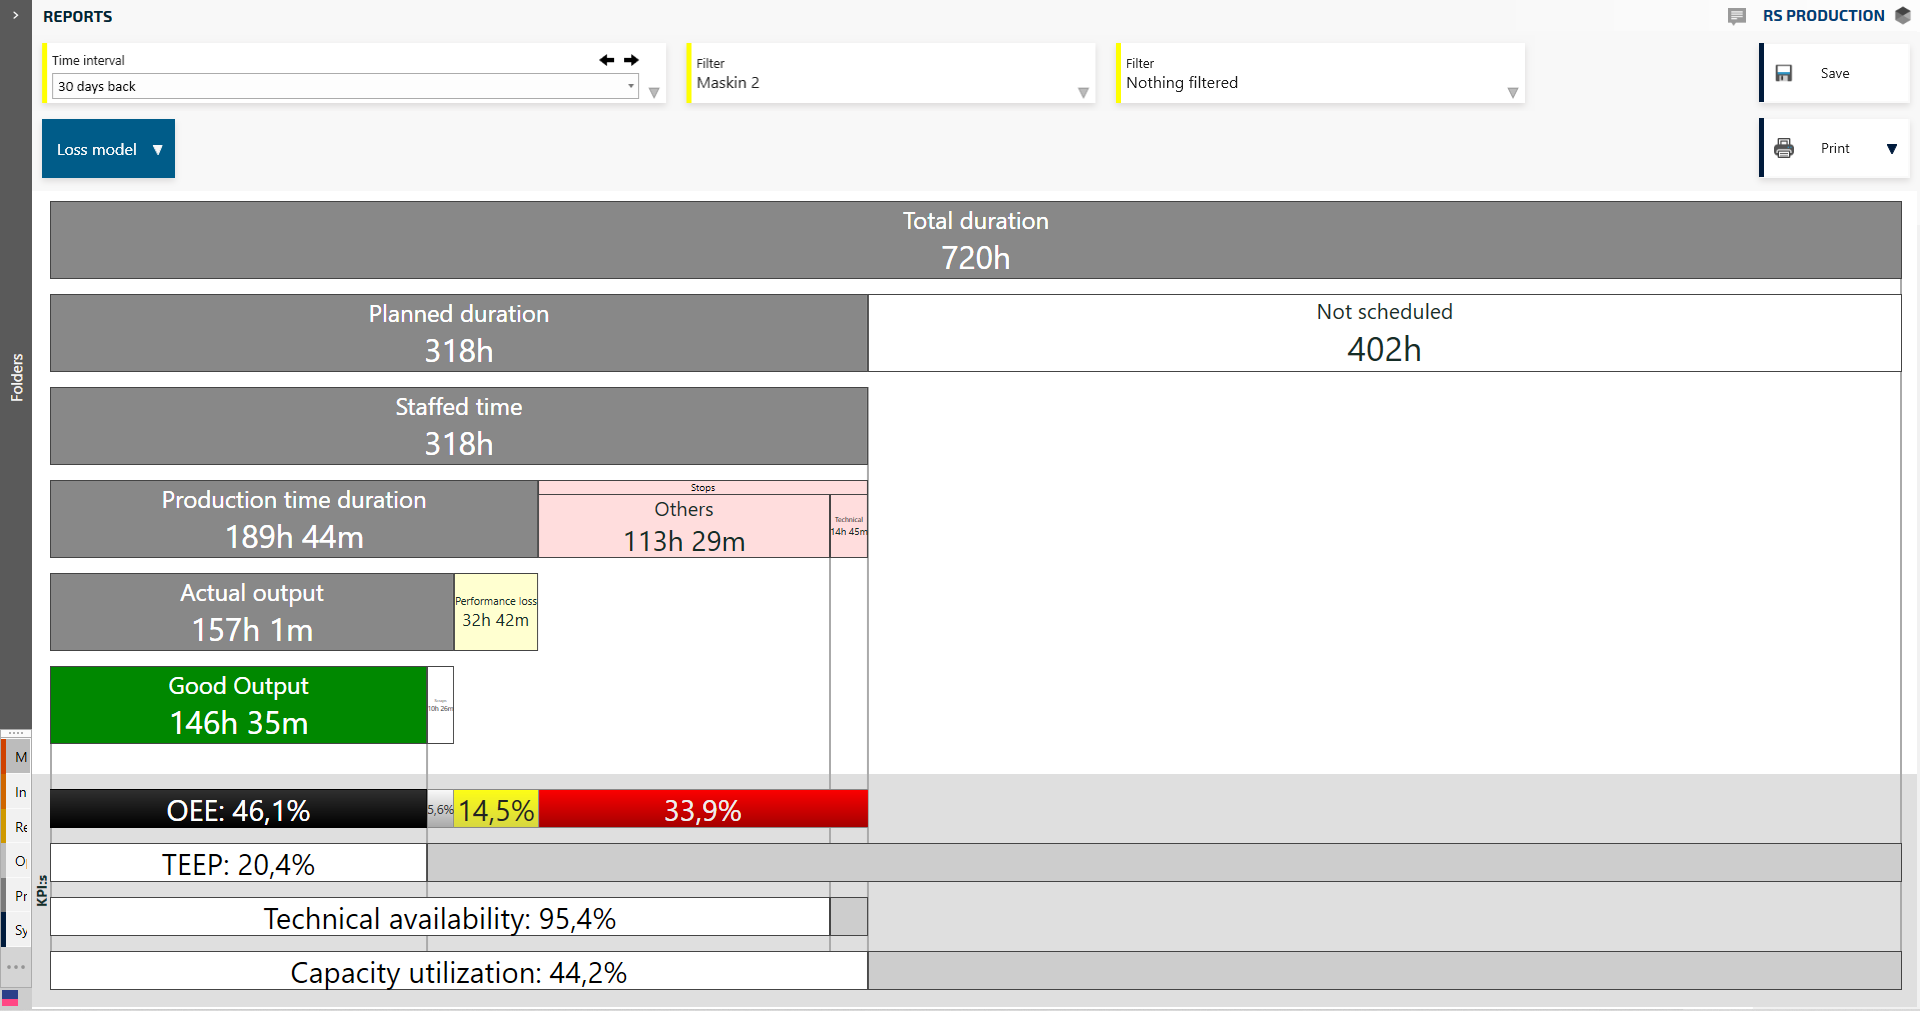
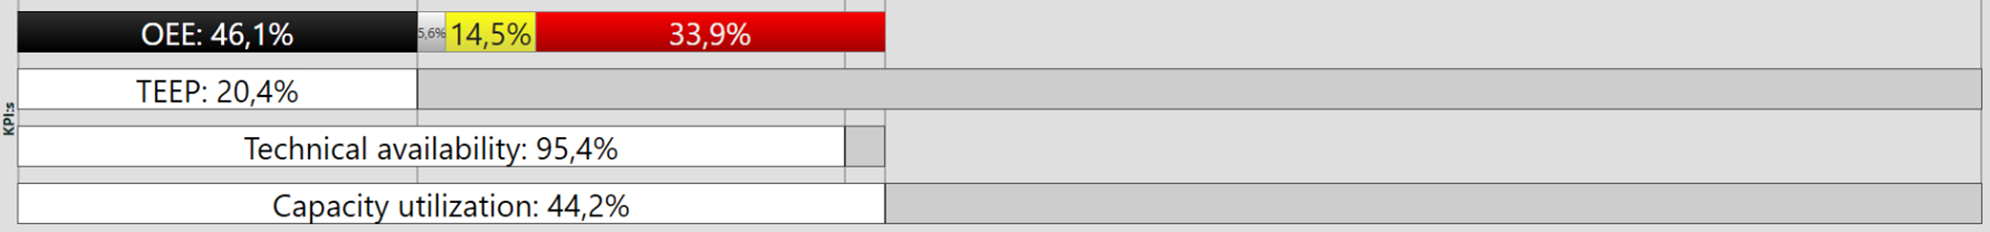
The loss model report gives a quick understanding of how large share of machine time that is used to really produce something valuable for the customer. The rest of the time is different type of losses.
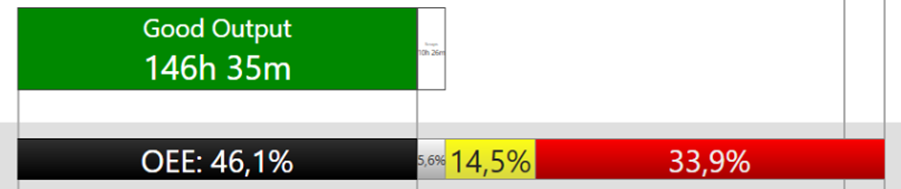
In the example above, 146 hours and 35 minutes were used to produce good products to the customer. The rest of the 318 hours where different types of losses.
This means that the OEE was (146h 35m) / (318h) = 46,1 %
The losses was 53,9%
Losses are hidden capacity
What would it mean to your factory if you could convert some of the losses to production time? Go here to get some inspiration on Better payback on your investments in machines and factories
Get an overview of losses
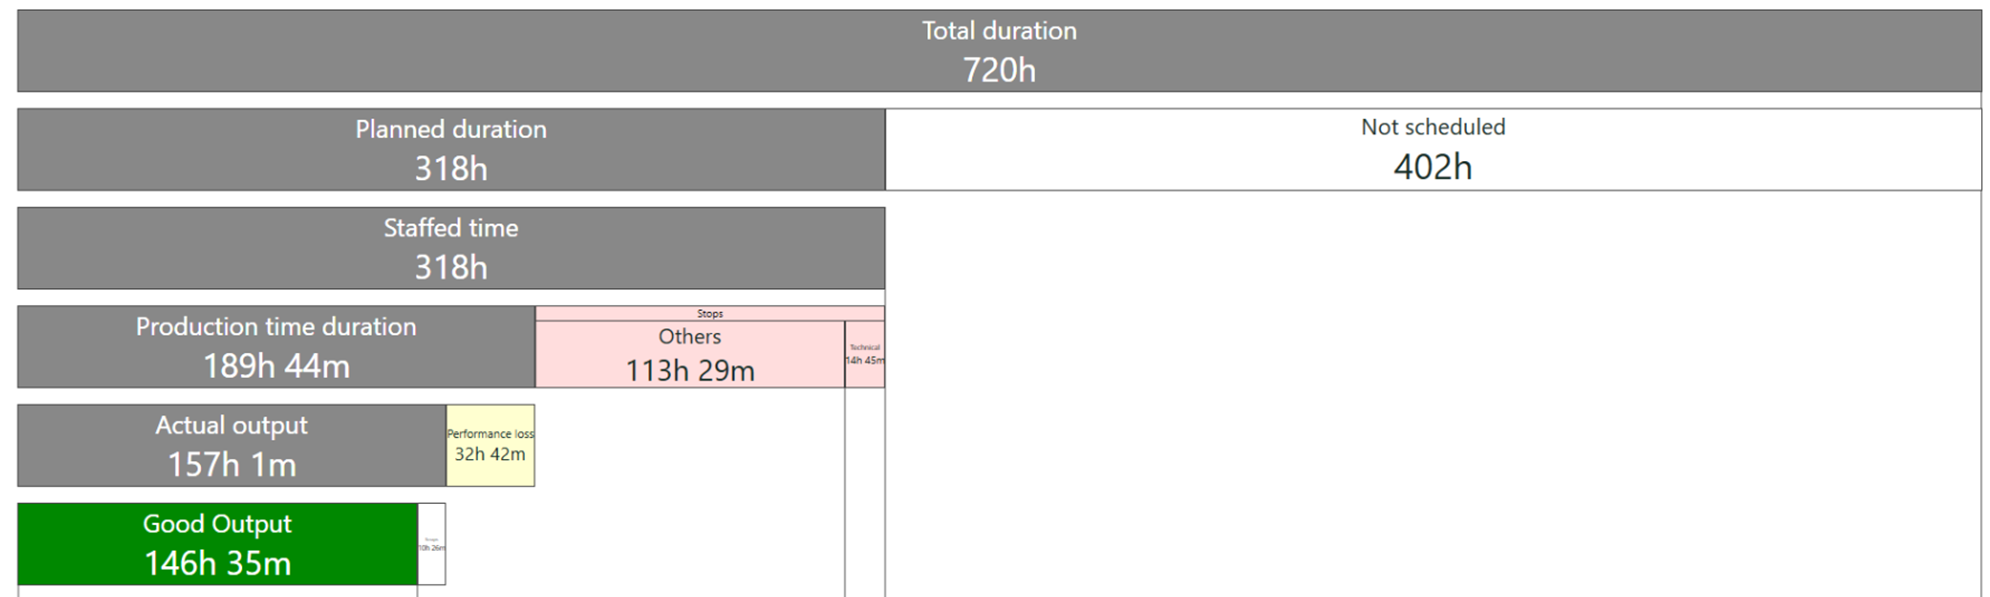
The loss model report provides a high level picture of where (possible) value adding time is lost.
The pink area shows to total amount of stoppages and downtime losses. This includes both planned and unplanned downtime as well as change over time and micro stoppages. In OEE, this is explained as availability losses.
The yellow are shows the speed losses. This is the time lost when you are running slower than the defined optimal speed/cycle time. The process is running, but it is not producing in the paced it is designed for. In OEE, this is explained explained as performance losses.
The light grey are shows the total time losses caused by quality issues. This is mainly scrap and can also be rework (depending on settings). In OEE, this explained as quality losses.
Drill down to identify underlaying reasons
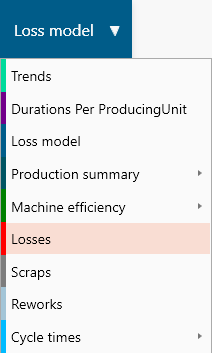
When you want to go beyond this high level overview of losses, click Losses (or Scraps, or Rework) in the report selector on the top left corner. This will take you to the drill down reports where you can see why and where the losses happened.
See total effective equipment performance (TEEP)
While OEE uses the planned production time as base for 100% efficiency, TEEP is instead comparing to all available calendar time. 24/7/365.
In the exempe above, the loss model report tell us that the equipment have been used for customer value adding production only 20,4% of the total calendar time.

See the technical availability
Within maintenance, there are a several well defined performance indicators drescibing the usage of equipment time.
Technical availability describes the chance that the machine works as expected when production needs to use it. In the example above, the technical availability is 95,4%. It means that every 20th time production wants to use the equipment, it is technically not available.
The losses effecting the technical availability is a part of the pink area and it includes the downtime with reason codes assigned to the “Machine” category. Read more about Reason codes, categories and station codes.

If you are interested in other maintenance indicators, there’s a specific report handling mean time between failure (MTBF) and mean downtime (MDT) in the Maintenance report.
Find unutilized capacity
Unless you’re not on a 5-shift model, you’re probably not utilizing your equipment to 100%. In the example above, the capacity utilization is 44,2%.
The loss model report help you see unplanned machine hours. It is the other 55,8% in the example. It might be costly to open up more work shifts, but you are already paying for the machine capacity.

What information is shown?
OEE loss model
Total duration | Total amount of time for all selected measurepoints with the assigned filtering.
| ||
Planned duration | Time planned for production. When the initial plan was to produce. In RS Production OEE this is defined with the Scheduling function. | Not scheduled | = Total duration - Planned duration |
Staffed time | Time really used for production. Equal to or less than Planned duration. Compared to Planned duration, remove time without anything to run, or other time you want to exclude from OEE. Use “exclude from OEE” on downtime reason codes. | Excluded time | Total amount of time with downtime reason codes marked with “exclude from OEE” |
Production time duration | The time when the production process is up and running. | Other stops + Technical stops | Sum of all downtime (changeovers, planned stoppages, unplanned stoppages and micro stoppages). Technical stops is a sub part of the above, with the downtime with reasoncodes assigned to the category “Machine”. |
Actual output | The produced amount re-calculated to how long time it should take when running in Optimal cycle time. This is set either on measure point level, or per measure point and article. | Performance loss | Sum of all time that is lost when running slower than the optimal cycle time. |
Good output | The approved amount re-caclulated to how long time it should take when running in Optimal cycle time. | Quality loss | Actual output minus the time for scrapped units (and reworked units, if that setting is active). |
Key performance indicators
OEE (see instruction below for how to see detailed OEE calculation) | Quality loss - time lost caused by scrap (and possibly rework). | Performance loss - time lost caused by running slower than optimal cycle time | Availability loss - time lost caused by any type of stoppage and downtime. |
TEEP | How large share of the total calendar time (24/7/365) that is used for customer value add. | ||
Technical availability | How likely it is that the machine will be technical available when production is planned. | ||
Capacity utilization | How large share of the total calendar time (24/7/365) that is planned for production. Rest of the time is unutilized machine capacity. | ||
See the exact math calculation behind the OEE and losses shown in your loss model report?
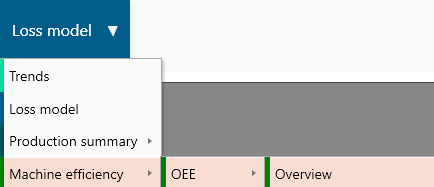
In the report selector in the top left corner, click Machine efficiency, OEE, Overview.
In the OEE report that opens up, hold your mouse pointer over any OEE-bar and click “Open”. In the popup that shows, select “OEE Calculation” in the left menu.
See this data in table format and export it
There are several table reports (Shifts, orders, articles, day report) that have this raw data. From there, you can export to Excel (click the button at the bottom right corner of the page).