Losses report
This is a feature in the RS Production OEE product.

The losses report is one of the “hero reports” in RS Production OEE showing WHY and WHERE efficiency (OEE) is lost.
It offers a combination of a simple front with strong flexible ways to drill down and identify patterns and thesis for root cause analysis.
How to use the losses overview report?
Facts for pulse meetings and decision making
asd
Find the biggest losses
sdf
Follow loss trends
sad
Options in the Losses report
The options below are for all different sub reports in the Losses report. They help you set how you want to look at your loss time (hidden capacity).
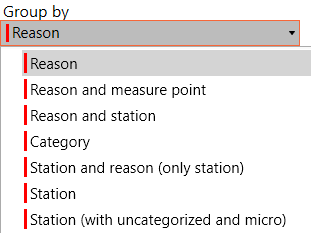
Group by reason codes and/or stations and/or categories
By default, the pareto diagrams in the overview report show information per reason code. Depending on how your RS Production OEE is set up, you might want to look at the same data from different angles. Read more about Reason codes, categories and station codes.
Group by enables you to see the loss statistics group on combination of reasons, stations and categories

Filter to see only selected reason codes/ stations
When you want

Filter to see downtime and/or speed losses
asdf

What information is shown in the Losses overview report?
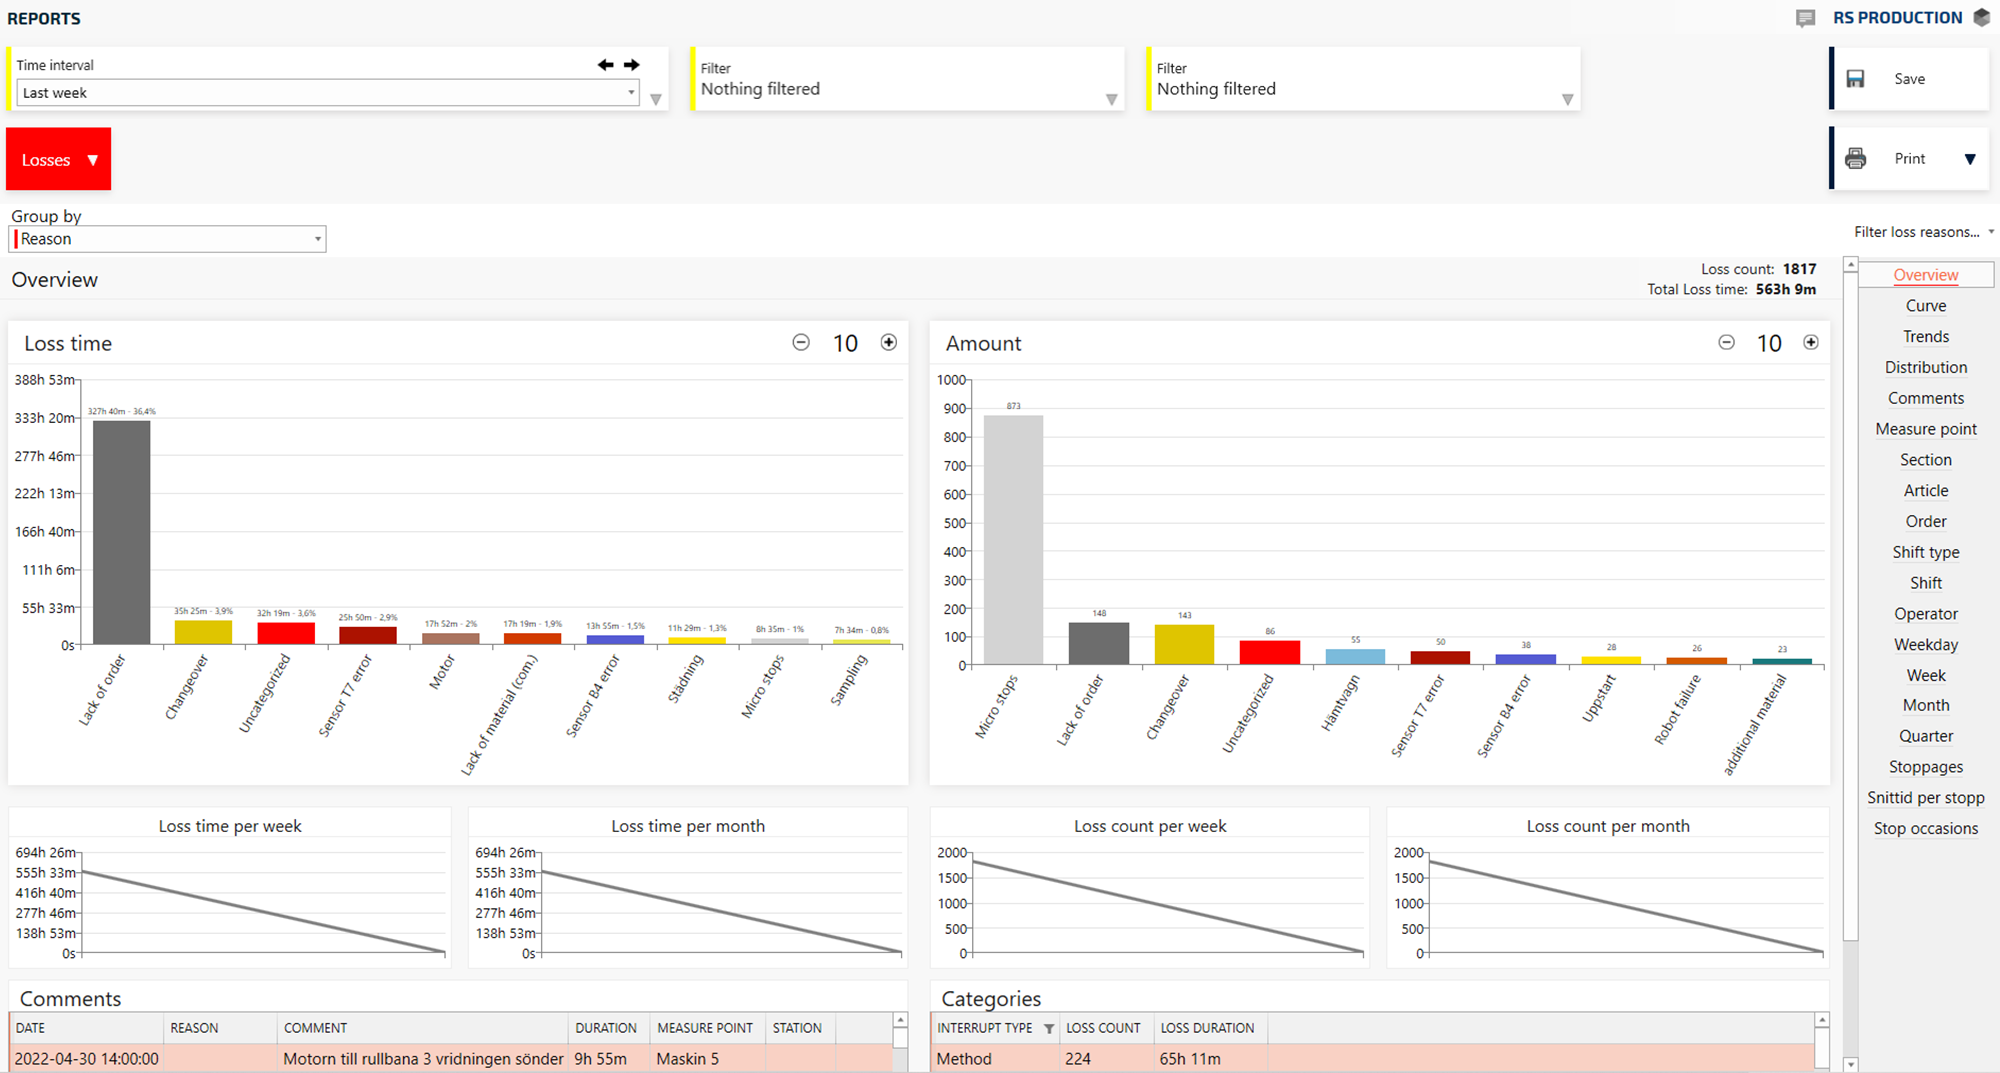
Loss pareto (time + amount)

Use [+] and [-] buttons to show more or fewer reason codes/stations/categories.
Loss time and amount per week and month
asd

Loss comments table
asdf

Loss categories table
asdf

How to use losses sub reports?
Losses - Trends report
asdf
Group by dimension
Group by time
Sort on dimension


Hover over a bar to get a detailed view of the losses.
Losses - Distribution report
asdf
Losses - Comments table report
asd
Losses - Stoppages table report
asd
Losses - Stop occassions report
asdf
All the rest of the Losses sub reports (Measure point, Section, Article etc)
asdf
See this data in table format and export it
asd