Cycle times report
This is a feature in the RS Production OEE product
How to use the cycle time report?
Cycle times, Measure / article is like a tired less time study. The report help understand true cycle times and true (plannable) production timed per unit.
Find your true cycle times
It can tell you the difference in cycle time between different one or more products (articles) on one or more machines (measure points).
It also give you a visualization of your availability and performance losses for different product (articles) and machines (measure points).
Update your production engineering data
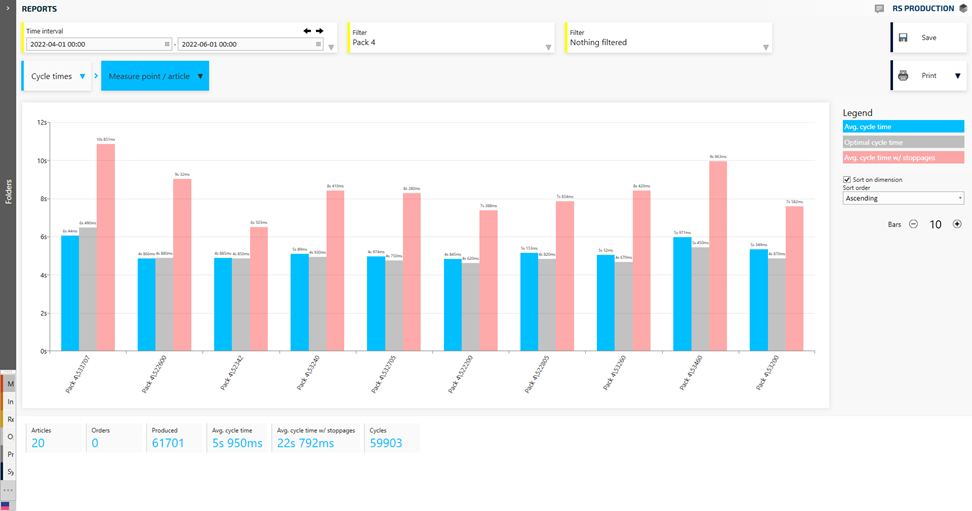
The cycle times report show you the true measured cycle times (blue bars). This is the cycle times when the measure point status is “Ok/Running”.
Update your ERP and planning parameters
The cycle times report also show you the true plannable time per unit including different both stoppages (OEE availability) and speed losses (OEE performance). This is shown in the red bars.
We suggest that the time in the red bars are used for updating pre calculations and planning times in ERP and other systems.
Identify bad optimal cycle time in RS Production OEE
✔️ If the blue bar (cycle time) that is lower than the grey bar (Optimal cycle time), it means that you are running in a higher pace than your OEE-setting for optimal speed.
Over a longer period, this will cause “health issues” for your OEE measurement.
We suggest that you adjust your optimal cycle time to not be higher than the measured cycle time.
See Data health check reports for more ways to identify and adjust bad data.
What information is shown?
Bars
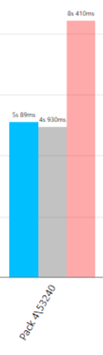
The name below the bar shows measure point name and article name.
The blue bar shows the measured cycle time (when production is up and running).
The grey bar shows they Optimal speed (100% OEE performance) setting.
The red bar shows the measured time per unit including also downtimes and micro stoppages.
Summary
Articles | The number of products (articles) run in the selected time frame and data filtering |
Orders | The number of orders run in the selected time frame and data filtering |
Produced | The produced amount in the selected time frame and data filtering |
Average cycle time | Total average cycle time in the selected time frame and data filtering |
Average cycle time with stoppages | Total average time per unit (including both speed loss and downtime losses) in the selected time frame and data filtering |
Cycles | The number of cycles in the selected time frame and data filtering |
See this data in table format and export it
The table report “Articles” have the same data. From there, you can export to Excel (click the button at the bottom right corner of the page).
Mean in production cycle time = average cycle time (the blue bar)
Mean work time cycle time = average time per unit including both speed loss and downtimes (the red bar)