Overview of screens components
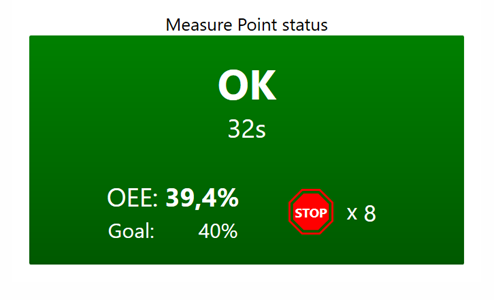
Measure point status
Shows the current status and the time spent in the current status for one measure point. Current OEE value, OEE goal and number of uncategorized stops is also shown.
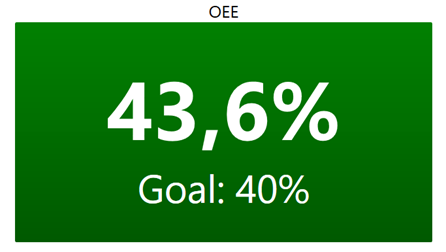
OEE
Displays the OEE value and OEE goal for a selected measure point and time frame.
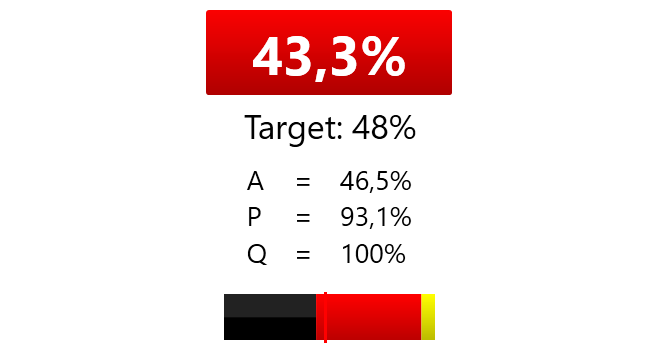
OEE Details
Shows OEE and Availability, Performance, Quality components for the selected data.
The upper area (43,3%) is red when OEE < Target.
The bottom area shows the OEE target as a vertical line (in red).
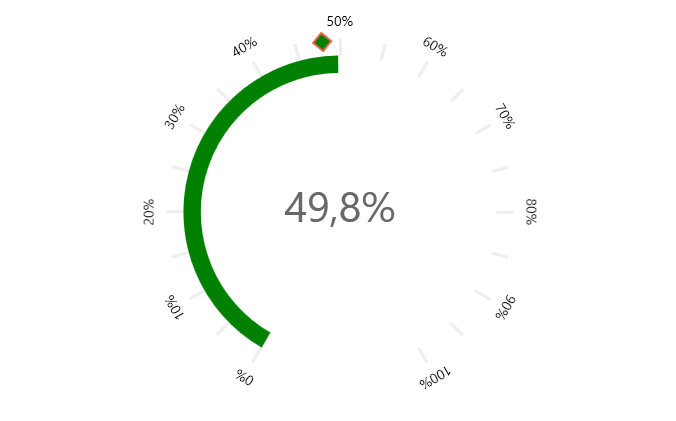
OEE Speedometer
Displays the OEE value and OEE goal for a selected measure point and time frame.
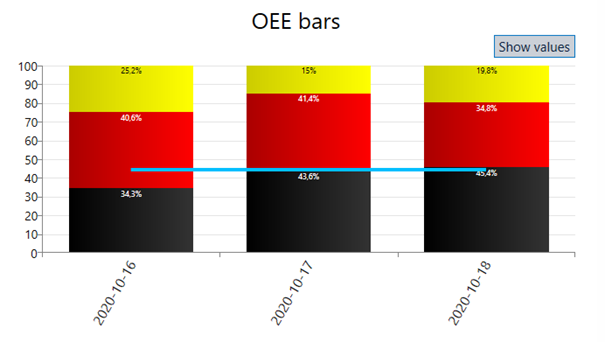
OEE bars
Displays the OEE value as bars and the OEE goal as a line.
The selected data series can be grouped by either data dimension or time interval.
OEE line
Displays OEE value and the OEE goal as a line.
The selected data series can be grouped by either data dimension or time interval.

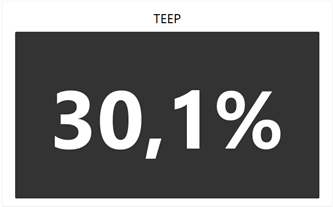
TEEP
Displays the TEEP value for the selected data filters and time interval.
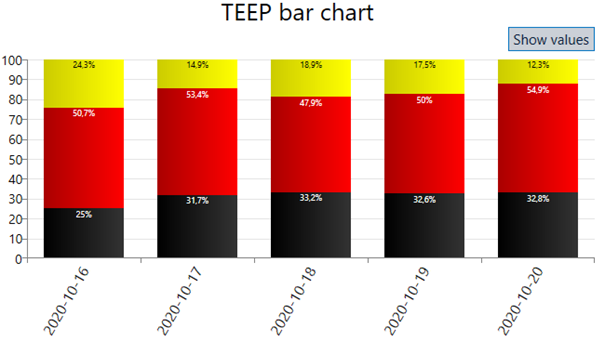
TEEP bar chart
Displays the TEEP value as bars.
Stop grouping (graph and legend)
Displays all (or selected loss reason codes). Both stop losses and speed losses. Filter on reasons, categories and stations.
The component shows three data per loss reason/category/station.
Duration
No of stops
Missed potential production amount
Group by combinations of reasons, categories, stations and stop occassions.
Display, Bars and Legend
The Display, bars and legend settings offers several options to configure how the losses should be visualized.
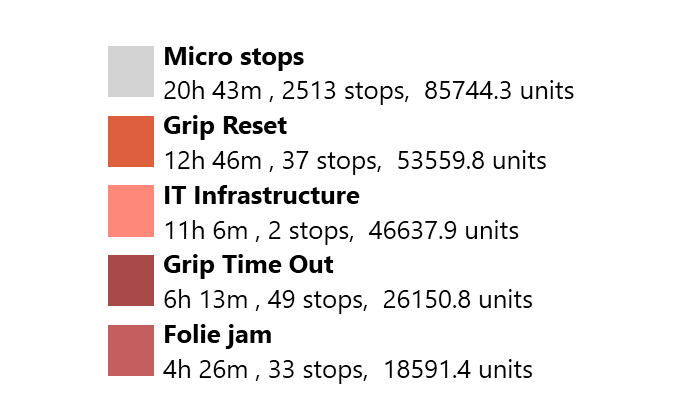
Legend only
Shows no bars, only the legend.
Graph and legend
Shows both bars and the legend. Use the Bars settings (vertical/horizontal) and Legends settings (bottom/left) to configure the visualization.
Legend bottom | Legend left | |
|---|---|---|
Bars vertical | 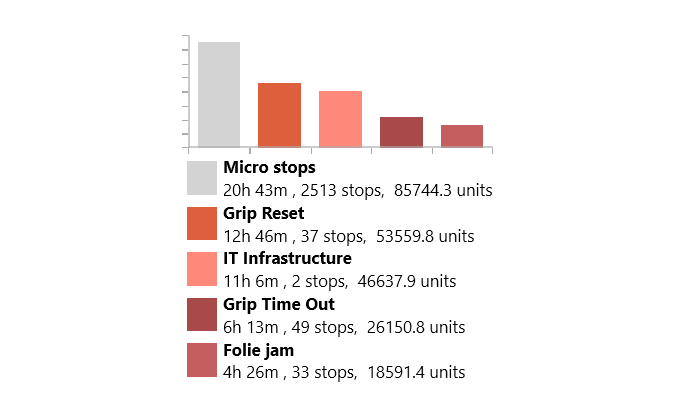 | 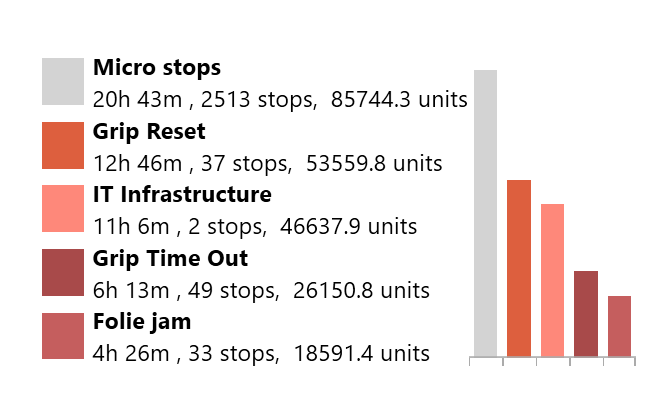 |
Bars horizontal | 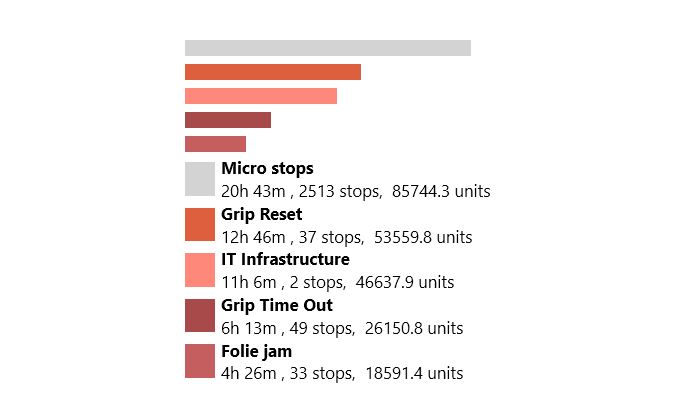 | 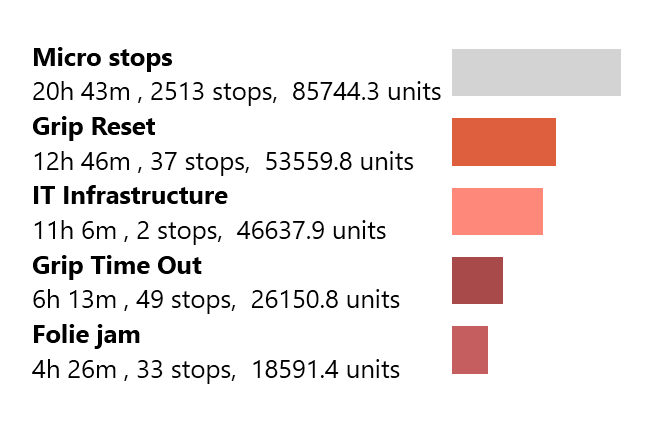 |
Amount
Use +/- to adjust the length of the tail
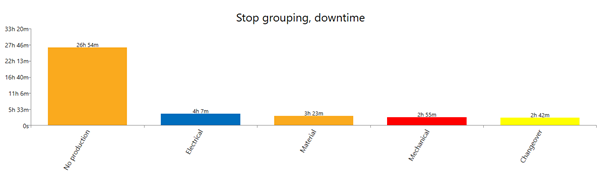
Stop grouping, down time
Displays a Pareto diagram over stop time with an unlimited number of bars. Possible to filter on reason code, reason category and station.
The selected data series can be grouped by either data dimension or time interval.
The data series can be sorted by either ascending or descending order.
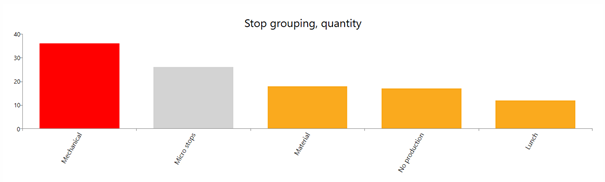
Stop grouping, quantity
Displays a Pareto diagram of amount of stops with an unlimited number of bars. . Possible to filter on reason code, reason category and station.
The selected data series can be grouped by either data dimension or time interval.
The data series can be sorted by either ascending or descending order.
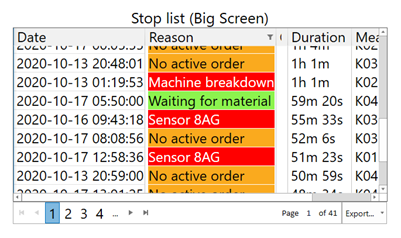
Stop list
Possible to filter on stop reason codes, stop categories and stations.
It’s possible to select if all stops, all stops except micro stops, only stops that have a comment, uncategorized stops or stops that are excluded from the OEE value should be shown.
The stops can be sorted by length, time stamp for start or stop, and reason code. It’s also possible to choose if it should be shown in ascending or descending order.
It’s also possible to select the amount of stops that should be shown.
The list can be exported to excel.
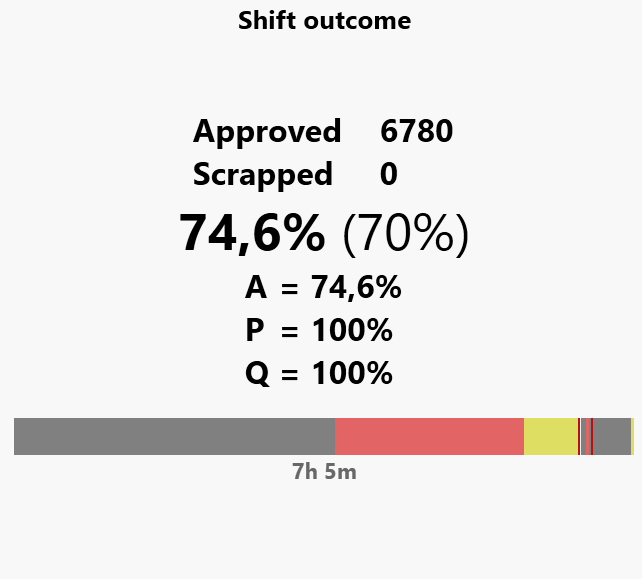
Shift outcome
Shows status for the current work shift for one measure point.
Production values
You can select how many different production values you want to show (0, 1, 2 or 3 positions). On each position you can select any of the Production values (see further below on this page) like Approved, Scrapped, Downtime, Cycle time and many more.
OEE
It is optional to show OEE and its three APQ-parameters.
Downtime timeline
The timeline at the bottom have three different ways to visualize the shift time.
All stops - Timeline shows all stops with their reason code color. Running time is shown in a dark grey color.
Show only the first and last stop - Timeline shows only the first and last stops on the shift. This is useful when you want to highlight the shift handover times.
Highlight the first and last stop - Timeline shows all the stops with their reason code color. In addition to that, it highlights the first and last stops on the shift to put focus on the shift handover times.
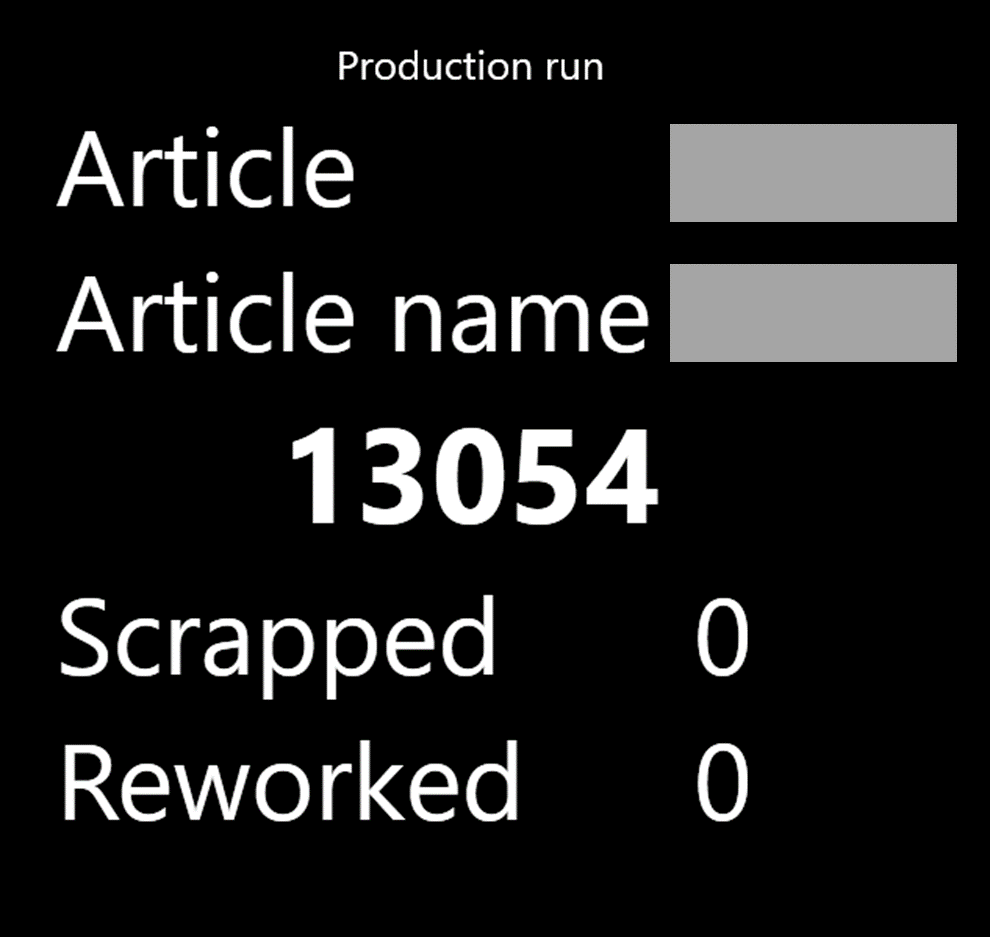
Production run (for order run)
The Production run component automatically shows information for an order run if the selected measure point has an active order run.
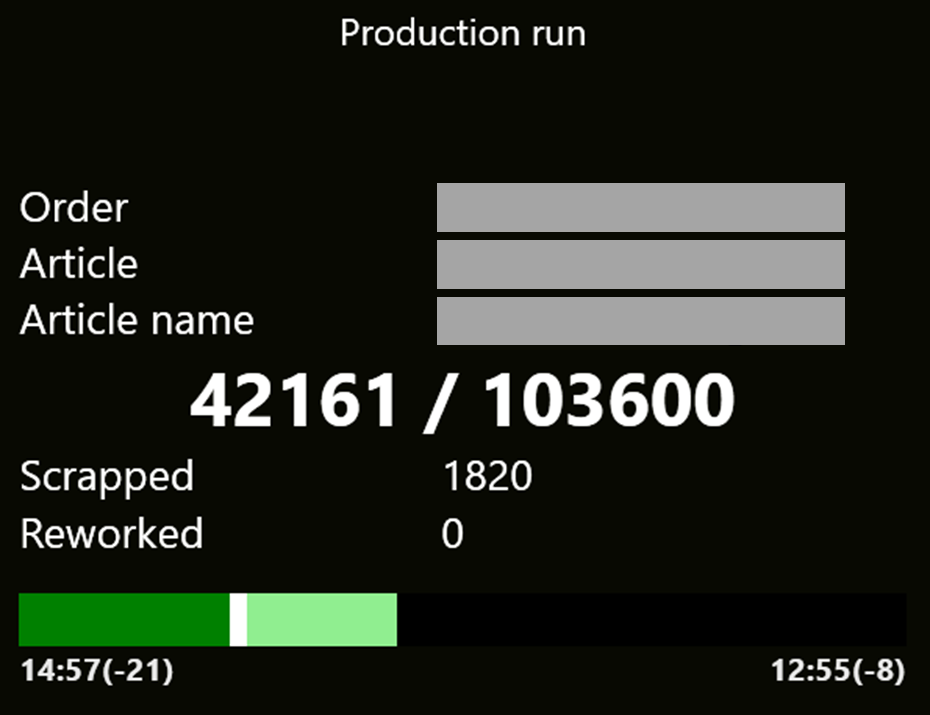
Order information
The component automatically shows order id, article and article name.
Approved / ordered amount
The component automatically shows approved (produced - scrapped) and ordered amount.
Production values
You can select how many different production values you want to show (0, 1, 2 or 3 positions). On each position you can select any of the Production values (see further below on this page) like Approved, Scrapped, Downtime, Cycle time and many more.
Progress timeline
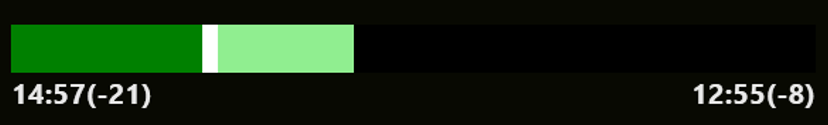
When the green bar have reached all the way to the right, you have produced the ordered amount. The timeline shows if you are ahead or behind the OEE target.
The white line shows where you are supposed to be right now (your target)
If you are ahead of your OEE target, there is an addition light green bar to the right that describes how far ahead of your target you are.
If you are behind your OEE target, there is a red bar to the left of the white line that describes how far behind of your target you are.
Ahead | Behind |
|---|---|
You are ahead of OEE target if it has a green part to the right | You are behind OEE target if it has a red part to the right |
 | 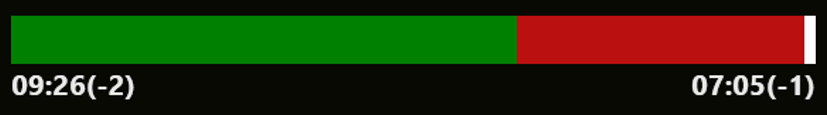 |
How far have we come on the order? The total green length describes how big part of your order you have produced. | How far have we come on the order? The length of the green bar describes how big part of the order that has been produced. |
When can we expect the order to be ready? The time in the bottom right corner is the estimated time for when approved amount will reach the ordered amount | When can we expect the order to be ready? The time in the bottom right corner is the estimated time for when approved amount will reach the ordered amount |
Article run
Article information
The component automatically shows article and article name.
Approved amount
The component automatically shows approved (produced - scrapped) amount.
Production values
You can select how many different production values you want to show (0, 1, 2 or 3 positions). On each position you can select any of the Production values (see further below on this page) like Approved, Scrapped, Downtime, Cycle time and many more.
Timeline with table
Shows a detailed timeline per measurepoint.
The upper part of the timeline shows red/green to visualize if the measurepoint’s status was Ok (or not).
The mid part of the timeline is green when the measurepoint have the status Ok, otherwise it shows the color of the stop reason.
The bottom part of the time shows the current workshift. This part is optional to show.
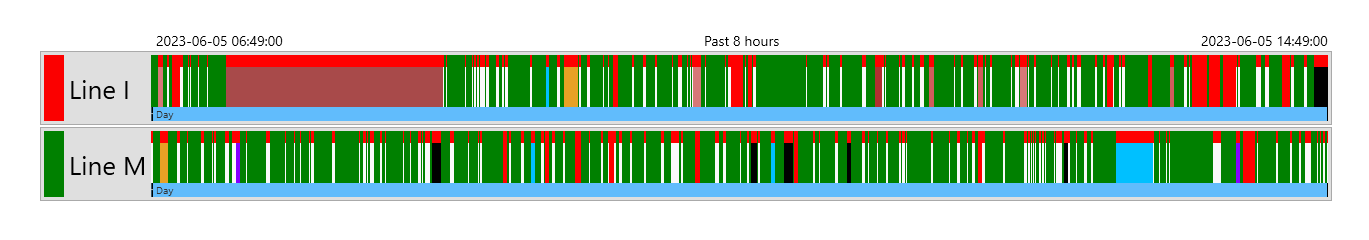
Table columns
This control have an option to show summarized data for the measurepoint in columns to the right of the timeline.
As default, all columns are hidden. All columns with a sorting number > 0 will be shown. Lowest sorting number to the left. Highest sorting number to the right.

OEE
A, P, Q
Speed
Produced amount
This shift, previuos shift, Shift before previous
Article
Duration values (grouped)
Displays a single duration value per configured grouping. Contains settings for which type of value to display per group.
Type of value
Runtime | Sum of time with measure point status = ok |
Downtime | Sum of time with measure point status = Stop |
Setup time | Sum of time with measure point status = changeover |
Total stop time | Sum of downtime also included the non scheduled time |
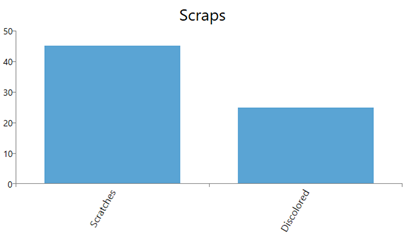
Scraps
Shows the amount of scraps per reason in a Pareto diagram, with the possibility to filter scrap reasons.
Document
Displays a selected document
Production value
The following values can be shown
The following Type of value selections are available
Category | Type of value | Comment |
|---|---|---|
OEE | OEE | |
OEE Target | ||
Availability | ||
Performance | ||
Quality | ||
Output | Produced | |
Production target | Calculated from optimum amount and OEE target | |
Approved | ||
Scrapped | Scrapped amount | |
Reworked | Reworked amount | |
Uptime | Runtime | Time in Ok mode |
Losses | Downtime | Time in Stop mode |
Changeover time | Time in changeover mode | |
Total stop time | ||
Speed | Speed per hour | |
Speed per minute | ||
Speed per minute (total) | ||
Cycle time (when running) | ||
Cycle time (total) |
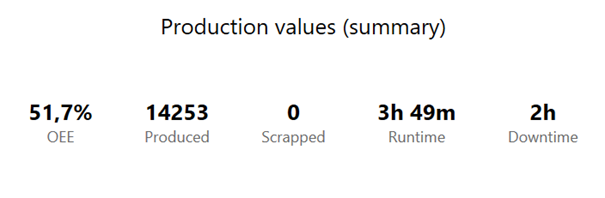
Production value (summary)
Displays up to five of the production values available in the Screen’s component Production value.
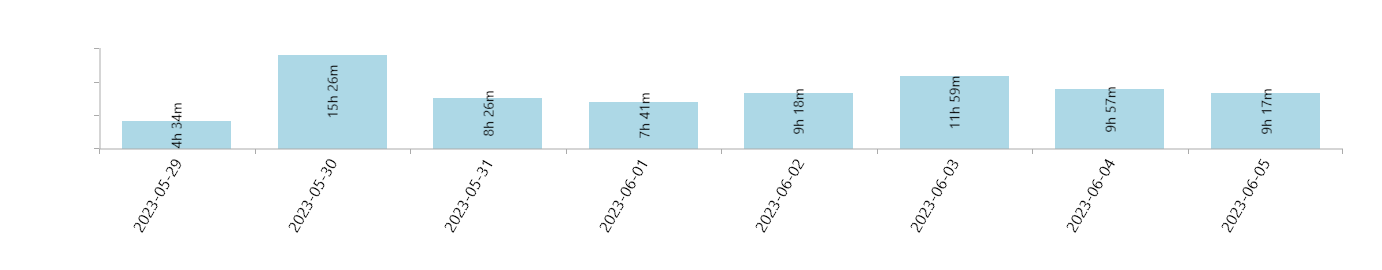
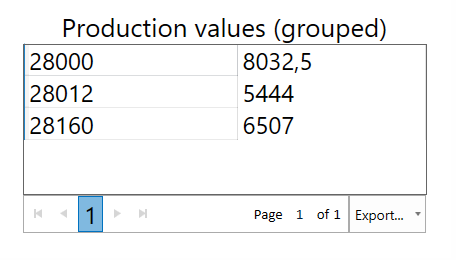
Production values (grouped)
Displays one of the production values available in the Screen’s component Production value. It is possible to group the values based on all available data dimensions and time intervals. The data can be sorted in ascending or descending order.
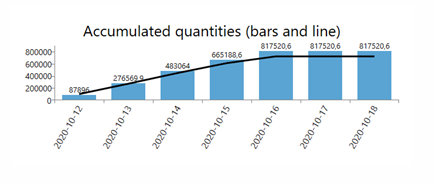
Accumulated quantities (bars and lines)
Can display two accumulated data series simultaneously, one as a bar and the other as a line.
It is possible to select from the data series; produced amount, production goal, approved amount, scrapped amount and reworked amount.
The selected data series can be grouped by either data dimension or time interval.
The data series can be sorted by either ascending or descending order
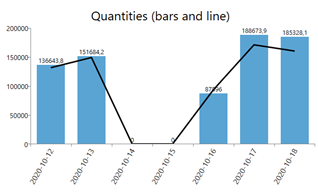
Quantities (bars and line)
Two data series can be visualized simultaneously, one as a bar and one as a line.
The following data series are available: Produced amount, production goal, approved amount, scrapped amount and reworked amount.
The selected data series can be grouped by either data dimension or time interval.
The data series can be sorted by either ascending or descending order.
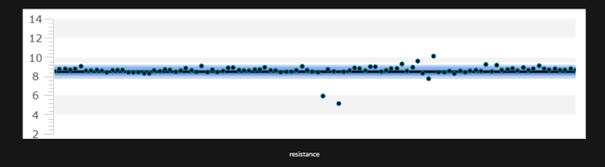
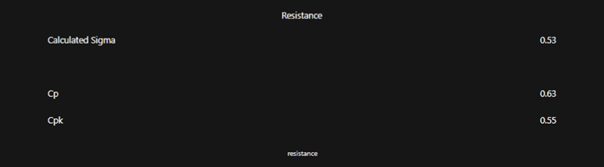
SPC
Displays calculate Sigma, Cp och Cpk for the selected data series.
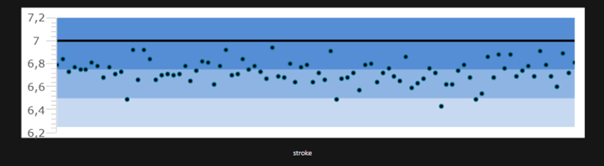
SPC – Dataseries
Displays the entire selected data series. The blue field shows +/- 3 Sigma (standard deviations) for a stable process.