Displaying your Energy data - InfoScreens
In order to more effectively display your Energy information on the factory floor or other areas where you need to visualise it, three new Screens components have been created.
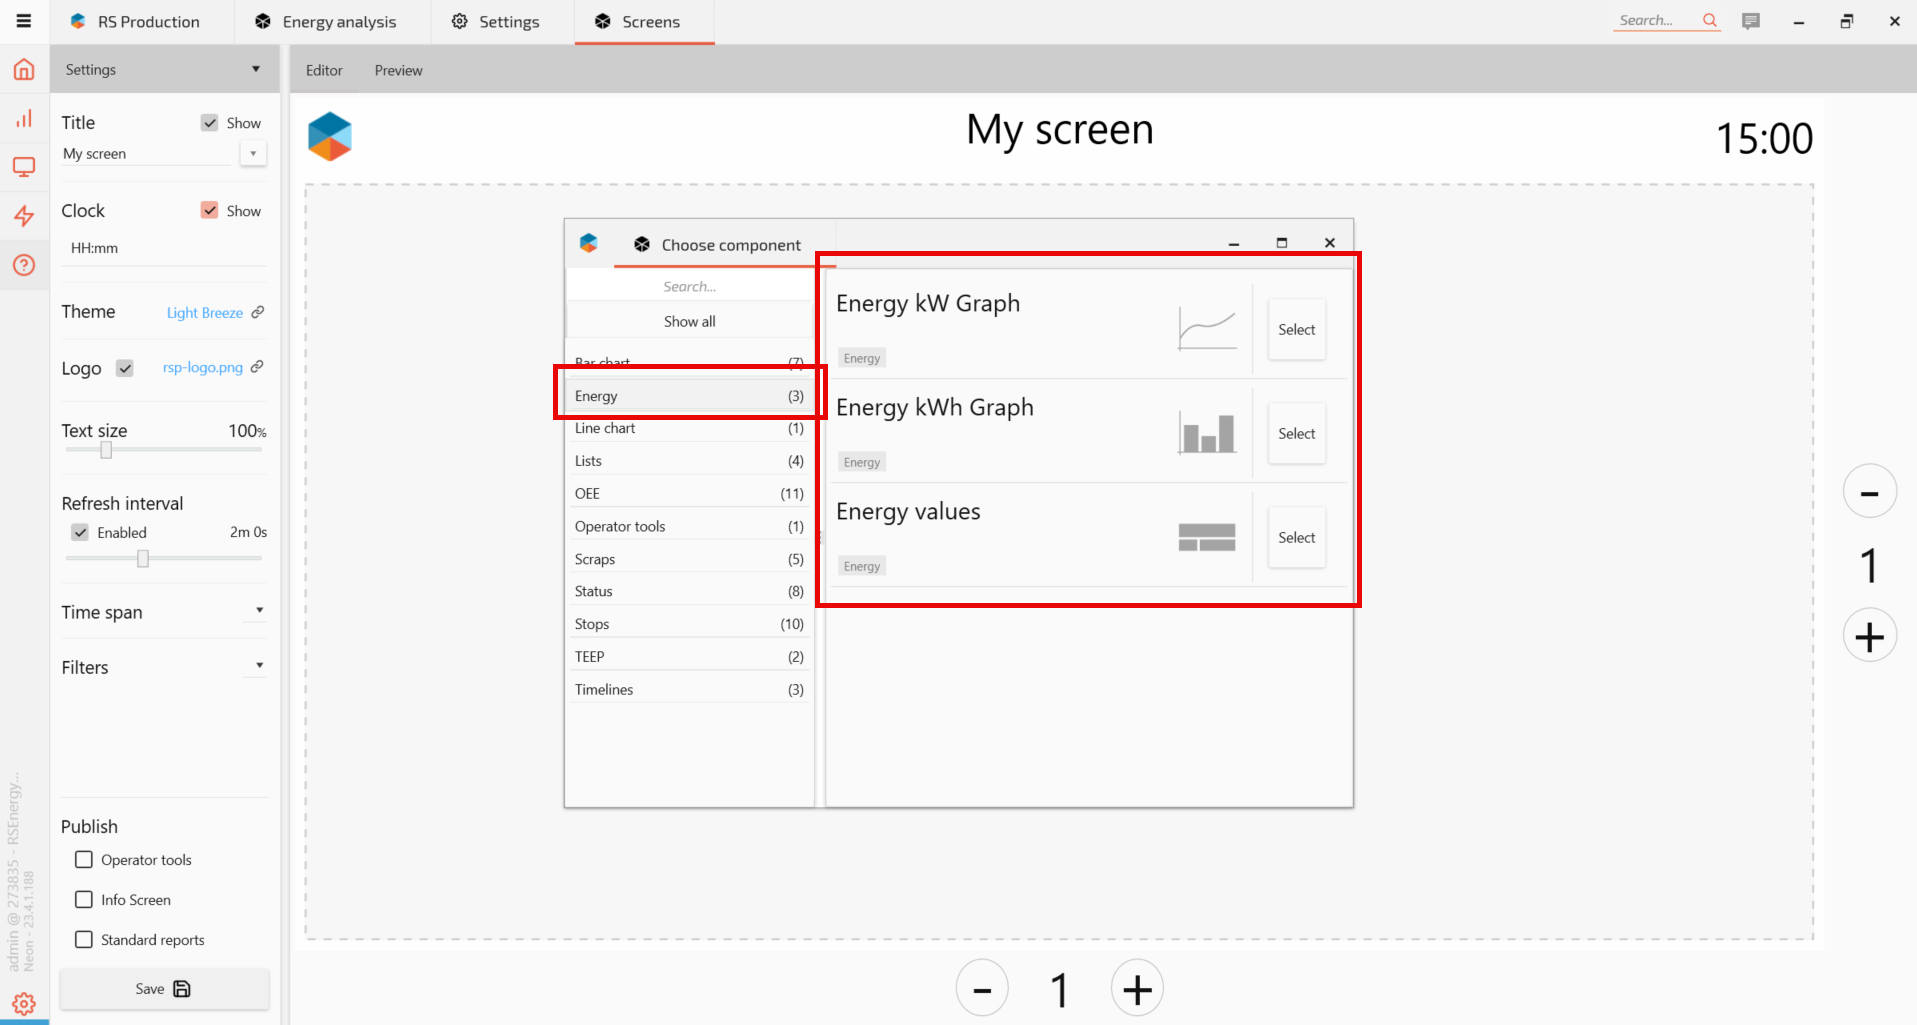
The graphs include:
Energy kW graph
Energy kWh graph
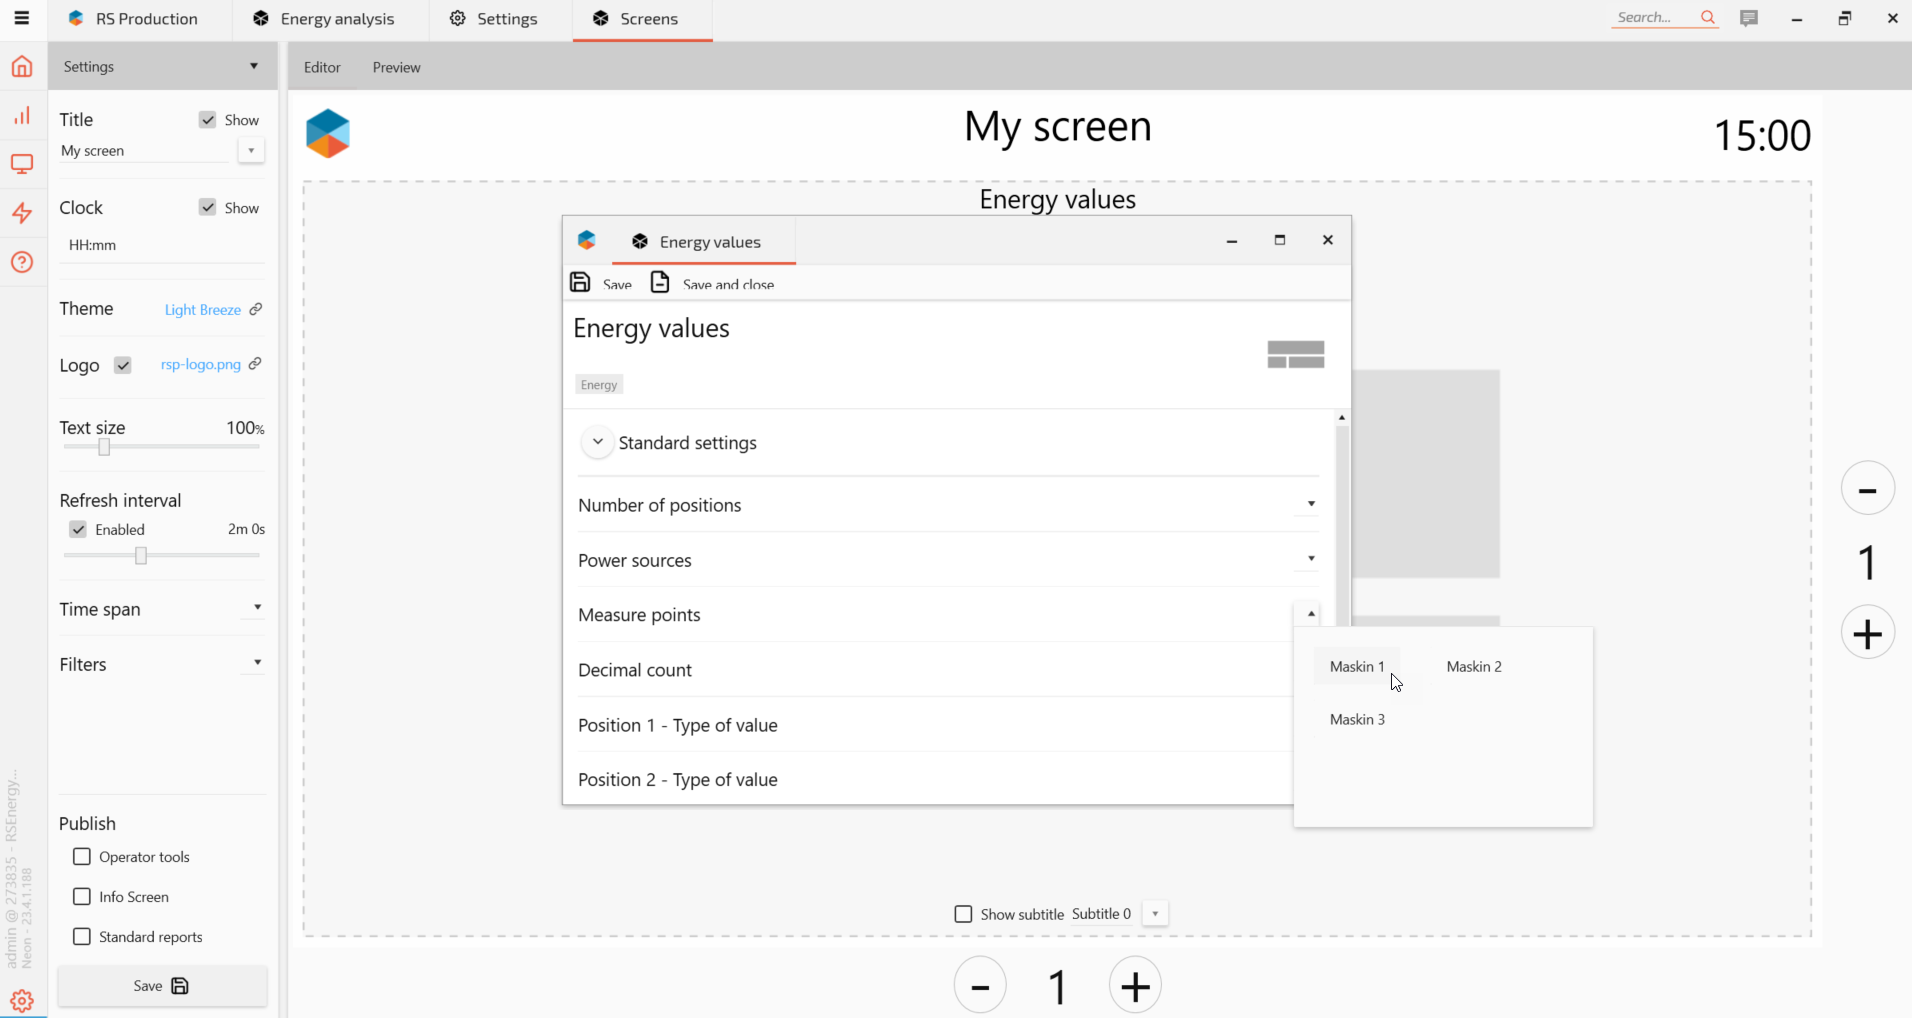
Energy values
The graphs can be configured to show the desired information, such as only a single measure point of select power sources.
In order to learn more about working with Info Screens, please refer to this article in the Knowledge Centre: