How you get started with pulse meetings using RS Production OEE
Setting up the structure
It doesn’t matter if you have just started using RS Production or if you have been using it for a long time; there are reports, tools and data readily available to help you get started with pulse meetings. Before we have a look at how RS Production can help you must answer these questions; who should be looking at what and when?
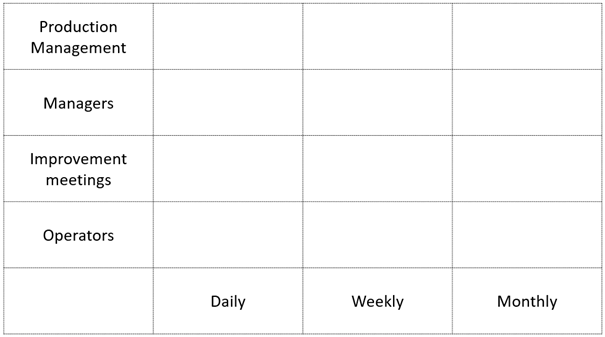
A great way to get started is to utilize a simple matrix such as the one below where you can enter roles and time interval so you can get an overview of your report and meeting structure.

Examples:
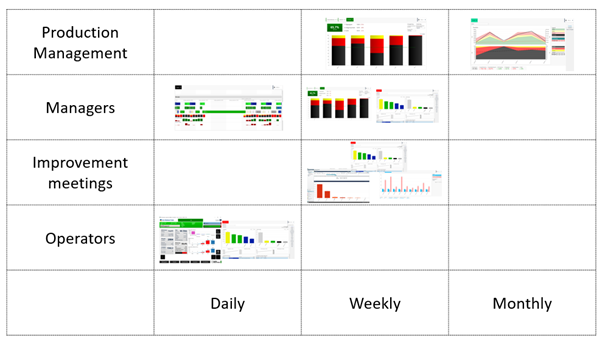
Daily/Operators – Reports for previous shift to compare the outcome to the production goal, these are also often complemented with some other report e.g. top 5 unplanned stops for the previous day.
Daily/Managers – It is important to ensure adequate data quality, so some function in a leadership position should daily use the Timeline report to make sure that production orders are started and finished at the proper time, that all stops are categorized and that the shifts are have the right start/end time.
Weekly/Improvement meetings – Reports for improvement meetings are of course more specific and related to the desired improvement, e.g. reports for a longer time interval for a specific stop reason, cycle time report for certain articles, reports for overarching stop categories and so on. The reports you look at depends on what improvement, deviation, focus area etc. that you are working with.
Weekly/Managers – As the time interval increases, so does the aggregation, for managers it might start to become interesting to compare the current weeks OEE to previous weeks, managers might also follow-up improvement project and retrieve e.g. stop reports related to them.
Weekly/Production management – At this level the aggregation increases even more, and the reports usually are filtered to machines, groups, factory sections etc.
Monthly/Production management – At this level trend reports might be most interesting.
This is how the matrix can look like in “real-life”.

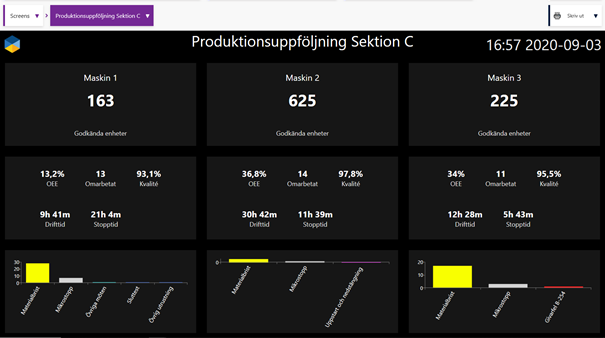
RS Production has a built-in tool called “Screens”, where it possible to build custom visualization. Here’s an example of a measure point summary built in Screens:

What is a good pulse meeting?
There are some tips and tricks to think of for your pulse meeting:
Start the meeting with something positive! It help create a more productive environment.
Have an agenda! It should be clear to everyone involved what the meeting is about.
Make sure someone is responsible for the meeting. With that being said, letting the leader of the meeting rotate can be a good way to inject energy
Invite relevant people. Think cross functional and what topics are discussed.
Have meeting rules: “Be on time”, “No mobile” etc. With a shared understanding of the rules, your meetings will run smoother and more efficient.
Prioritize the meeting. If it is important, you should treat it as such. If it is not important, should you really keep having it?
He said, she said… Avoid the blame game and make sure you focus on what actions to take and how to make things better.
Was it a good meeting? Why not end the meeting with asking. That way you get instant feedback and know if you need to make adjustment.
Agenda
Having a clear agenda will help the participants to prepare and understand the focus of the meeting. It also enables rotating leader of the meeting as anyone can follow the agenda items.
Here is an example of what a morning meeting agenda in production could look like:
Safety
Outcome (previous day / shift…)
Volume
Delivery precision (on time)
Quality
Did we do our routine chores? (operator maintenance / cleaning etc)
Did we do the planned actions from Action log?
Today’s plan
Volume
Staffing / absence
Routine chores to be done today?
Actions to be done today?
General information